Les sources de radiation électromagnétique qui pourraient causer des échos réels ou apparents sur l'affichage radar incluent des radiateurs comme des reradiateurs. Certaines sources, telles que le [backscatter] électron ionosphérique, le Soleil et les planètes, ne sont pas considérés, puisque ne pouvant être détectées que par les radars de recherche les plus sensibles. Comme un radiateur comme le Soleil émettant suffisamment d'énergie dans les longueurs d'ondes de micro-ondes pour produire un signal de bruit. Ce signal a été utilisé dans des buts de recherche pour vérifier l'alignement de l'antenne radar. Des sextants radio ont été construits, suivant le Soleil a des longueurs d'onde centimétriques par la Collins Radio Co. Ce signal étant relativement faible il est peu probable qu'il soit remarqué lors d'opérations de routine d'un radar de recherche.
Les reradiateurs incluent des objets ou conditions atmosphériques interceptant et reradiant l'énergie transmise par le radar. Les objets varient en taille depuis le versant d'une montagne à des insectes. Les conditions atmosphériquent incluent des régions ionisées comme celles causées par des décharges de foudre et des inhomogénéités dans l'indice de réfraction provoqué par des discontinuités aiguës de température et d'humidité.
Le tableau 1 liste certains radiateurs et reradiateurs. Cette liste est incomplète, le développement de nouveaux types de radar ou les améliorations dues à la croissance évolutionnaire des radars existants résultant en de nouveaux types de cibles devenant détectables.
Les sources de signaux listées ont des ensembles de caractéristiques relativement uniques bien que dans de nombreux cas il y ait un certain recouvrement. Par exemple, un oiseau volant vite avec un vent d'arrière pourrait avoir des vitesses au sol comparables à un appareil léger avec un vent de face. A portée comparable, cependant, l'intensité du signal serait assez différente à moins que l'oiseau se soit trouvé dans le rayon principal et l'appareil dans un lobe de côté. Cette section discutera des caractéristiques et comportement typiques des signaux de retour et les informations auxiliaires nécessaires pour les confirmer ou les rejeter en tant que sources d'un écho donné seront mentionnées. Par exemple, comme mentionné ci-dessus, la connaissance de la vitesse du vent est nécessaire pour déterminer la vitesse aérienne d'une cible.
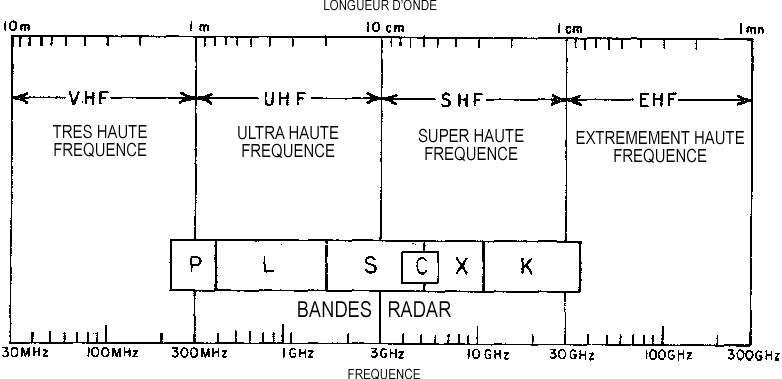
Dans la discussion de la détectabilité des diverses sources de signaux certaines bandes de fréquence spécifiques pourraient être mentionnées. La figure 2 illustratre les relations entre longueurs d'onde et fréquence dans les diverses bandes et montre les bandes radar spécifiques au sein du spectre de fréquence et de longueur d'onde.
Précipitations
Dans les années 1940s lorsque la technologie radar avança au point où des longueurs d'onde inférieures à la moitié de 1 m commençèrent à être faisables, les précipitations devinrent une cible détectable au radar. Ligda (1961) indique que la 1ʳᵉ observation d'orage au radar fut faite en Angleterre avec un radar de longueur d'onde de 10 cm (bande S). Depuis cette époque, le radar a été largement utilisé à des fins méteorologiques et des radars météorologiques spéciaux ont été conçus et construits spécifiquement pour des études de précipitations . De nombreux radars conçus dans d'autres buts que la détection météo se révélèrent très adaptés en tant que détecteurs précipitations. Ligda (1957) a étudié la distribution de précipitations sur de grandes régions des Etats Unis en utilisant des photographies PPI de radars du Commandement de la Défense Aérienne (ADC) pendant la période de à et pendant étudia la distribution des précipitations maritimes montrées par les photographies PPI de radars à bord de navires du 1er escadron de Radar Picket stationné au large de la côte ouest des Etats-Unis. Des programmes ultérieurs concurrents de plusieurs satellites météorologiques ont également utilisé des données de radars de l'ADC et de la Marine. Ainsi les radars conçus pour d'autres missions spécifiques sont souvent capables de détecter des précipitations et une compréhension du comportement et de l'apparence caractéristiques des précipitations est essentielle si l'opérateur radar doit interpréter de manière appropriée les cibles que détecte son radar.
Des études détaillées ont été faites des caractéristiques de retours radar issus de précipitations. Dans une étude des propriétés de micro-ondes des particules de précipitations, Gunn et East (1954) discutent des variations de signal de retour avec in return signal with wavelength and differences between the return signal from liquid and frozen water particles. Precipitation consists of a large volume of particles that generally fill the beam at moderate ranges. The received power at any instant is the resultant of the signals from the large number of individual particles. The particles are constantly changing position relative to each other (and to the radar site). As a result the signals from the individual particles sometimes add to give a strong return, sometimes subtract to give a weaker signal. This fluctuation in echo from precipitation is readily apparent on scopes that permit examination of the return from individual transmitted pulses. The fluctuation of the return signal is not, however, apparent to a radar operator monitoring the PPI of a search radar. This is because the persistence of the cathode ray tube used for PPI displays averages or integrates a number of pulses. Of importance to a radar operator concerned with interpreting the PPI is the variation of signal intensity with wavelength, with pulse length and with precipitation type. Particles that are large compared to the wavelength are more readily detectable than those that are small compared to the wavelength. Light drizzle may be barely detectable at short ranges while severe thunderstorms with large raindrops are detectable at ranges of 300 - 400 mi. When there is large hail falling from a severe thunderstorm the return signal may be quite strong.
Radar-detected precipitation may be in a variety of forms from very widespread continuous areas of stratiform precipitation of sufficient vertical extent to nearly cover the PPI of a long-range (150 n.mi.) search radar to only one or two isolated small sharp edged convective showers. The former is likely to persist for many hours, the latter for only a fraction of an hour. Between these two extremes there are many complex mixtures of convective and stratiform precipitation areas of various sizes. One of the distinguishing features of precipitation echoes is their vertical extent and maximum altitude. Usually precipitation echoes extend from the surface to altitudes up to 60,000 ft., although a more common altitude of tops is 20,000 - 40,000 ft. Further, isolated small volumes of precipitation seldom remain suspended in the atmosphere. The initial echoes from showers and thunderstorms may appear as small targets at moderate altitudes but subsequently grow rapidly. For example, Hilst and MacDowell (1950) examined the initial echoes from a thunderstorm. Horizontal measurements were made with a 10 cm. radar and the vertical measurements were made with a 3 cm. radar. Their first measurement showed a small horizontal area and a vertical extent from 11,000 - 18,000 ft. Presumably measurements a short time earlier would have shown smaller dimensions. Subsequently there was rapid growth to an area of 200 sq. mi. and a vertical extent from the surface to about 30,000 ft. The importance of this large vertical extent is that such an echo on the PPI of a search radar with a narrow beam can be present at a variety of ranges; that is, the beam will not be below the target at short ranges or above it at long ranges as would be the case with targets of limited vertical extent.
Since precipitation is less detectable at longer wavelengths and showers may have a quite short lifetime, it is possible that on rare occasions precipitation targets could confuse the radar operator. Consider for example a search radar operating at wavelengths of greater than 20 cm. in an environment where short-lived showers were occurring. A study by Blackmer (1955) using photographs from a 10 cm. radar showed a peak in echo lifetimes of 25 - 30 min. while the mean lifetime was 42 min. Also using data from an S band radar, Battan (1953) found a mean echo duration of 23 min. with the greatest number having lifetimes of 20.0 - 24.9 min. At longer wavelengths with short lifetimes, it is not impossible that an intense shower would be detectable only in the brief period during which it was producing hail, because a long wavelength radar might not detect small precipitation particles but could detect hail. Water-coated hail acts as a large water sphere and thus gives very strong return signals even at long wavelengths. Geotis (1963) found that hail echoes are very intense subcells on the order of 100 M. in size. When a number of short-lived showers or long-lived showers that were detectable only when hail is falling, are within range of a long wavelength radar, the PPI display could show over a period of time, a brief echo at one location, then an echo at a new location for a short period, etc. This might be interpreted as a single echo that was nearly stationary for a short period then moving abruptly to a new position.
One of the characteristics of precipitation echoes is that their motion is very close to that of the wind direction and speed. This wind velocity may not be the same as that observed at the radar site if the distance to the precipitation is great. Occasions have also been noted when precipitation echoes within a relatively small area have shown differences in motion due to being moved by different wind directions at various levels.
In general, however, precipitation is a relatively well behaved radar target and except for rare instances its extensiveness and orderly movement readily identifies it to the radar operator monitoring a PPI display.
Appareils
Le terme d'appareil inclut une large variété de véhicules, des planeurs sans propulsion aux avions à réactions militaires les plus avancés avec des vitesses de plusieurs fois celle du son. Une cible comme un appareil a une forme très complexe de nombreuses fois la longueur d'onde de l'énergie radar incidente. A mesure que l'énergie dispersée de différentes parties de l'appareil s'ajoute ou se soustrait d'autres parties, le signal retourné au radar fluctue. Les fluctuations de l'écho peuvent également résulter de changements de l'angle avec lequel l'appareil est vu. C'est-à-dire que lorsque un appareil est vu [broadside], sa section de coupe radar (et visuelle) est bien plus grande que lorsqu'il est vu par le nez ou la queue. Skolnik rapporte un changement de 15 dB dans l'intensité de l'écho pour un changement d'aspect de seulement 1/3 de degré. Des fluctuations de haute fréquence dues aux turbines à réaction et aux propulseurs ont également été rapportées. Ces fluctuations sont de l'ordre de 1000 cycles/s et ne seraient pas apparentes sur un PPI.
Bien que les échos d'appareils fluctuent en raison des modulations d'aspect et de propulsion, il y a une corrélation générale entre la taille d'un appareil et la quantité de signal retourné au radar. Une indication de la détectabilité relative de plusieurs appareils telle que donnée par l'Air Force (1954) est F-86 = 0,46, B-45 = 0,75, B-17 = 1,0, B-29 = 1,2. Les nombres signifient que, sur une un radar donné un B-17 était juste détectable à 100 miles, un F-86 aurait été juste détectable à 46 miles.
Les sections de coupe radar des composantes d'un grand appareil à réaction furent mesurées avec un radar de 71 cm et des valeurs maximum dépassant 100 m2 furent trouvées. Le fuselage du grand jet lorsqu'il était vu de l'avant ou de l'arrière avec une section de coupe de près de 1/2 m2. Des appareils plus petits auraient eu des sections de coupe radar bien plus petites d'environ 1/2 m2. Des appareils plus petits auraient eux des sections de coupe radar bien plus petites et des appareils légers ou des planeurs de construction en fibre de verre ou en bois auraient pu avoir des sections de coupe extrêmement petites.
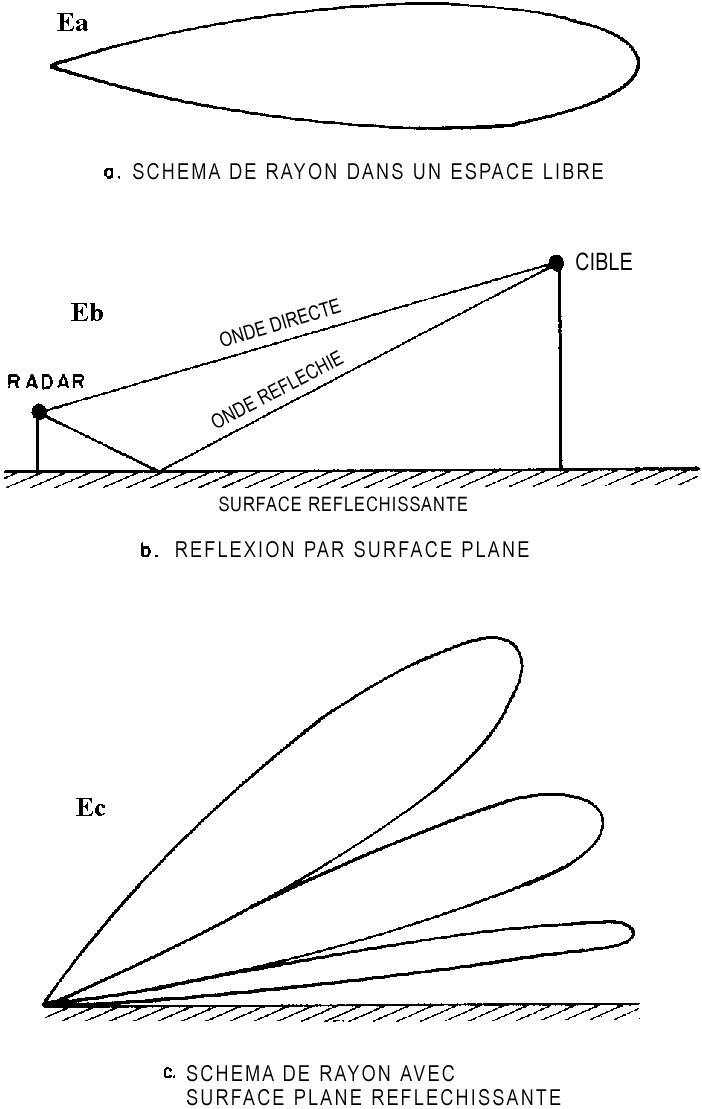
Un autre type de fluctuation dans le signal écho d'un appareil et de cibles ponctuelles semblables est dû à la nature de la propagation des ondes radio. Lorsqu'une onde radar se propage au-dessus d'une surface plane réfléchissante il y aura des réflexions depuis cette surface vers une cible en plus de la trajectoire directe du radar à la cible. La figure 3 illustre la géométrie de la distortion de rayon due à une telle surface plane réfléchissante. Dans la figure 3a est montré le schéma d'un rayon idéalisé dans un espace libre. Lorsqu'une surface réfléchissante telle que la surface du sol ou de la mer est introduite, une portion du rayon sera réfléchie depuis la surface comme en figure 3b. Une cible sera ainsi illuminée à la fois par une onde directe et une onde réfléchie. Le signal écho revenant de la cible au radar voyage sur les 2 trajectoires de sorte que l'écho est composé des deux composantes. L'intensité d'écho résultante dépendra de la mesure à laquelle les 2 composantes sont en phase. Les zones dans lesquelles les 2 composantes sont en phase résulteront en un signal plus fort résidant le long des lignes d'élévation angulaire de :
 (lambda = longueur d'onde et
ha = hauteur d'antenne).
(lambda = longueur d'onde et
ha = hauteur d'antenne).
Les 2 composantes sont out of phase and nearly cancel each other between the maxima. The resulting beam pattern thus consists of a series of lobes as presented schematically in Fig. 3c. As an aircraft flies along it will progress through the regions of maxima and minima, and the signal will fluctuate from near zero in the minima to a value near twice the free-space intensity in the maxima.
The foregoing assumes a plane, perfectly reflecting surface. Since the surface in the vicinity of a radar station is generally not a plane and its reflecting qualities vary the situation is much more complex than the idealized case.
The effect of these fade areas is to cause aircraft targets to sometimes disappear and then (if the target has not reached a range such that the return signal is no longer detectable) to reappear. With a number of aircraft flying about it is not inconceivable that the fadings and reappearances of the several aircraft would be difficult to keep track of and could be misinterpreted as a smaller number of targets that were moving quite erratically.
Considering the whole spectrum of vehicles that travel in the atmosphere, there may be speeds as low as 0 (hovering helicopter) or speeds exceeding Mach 3,0. Correspondingly, altitudes vary from the surface to 50 000 - 60 000 ft. (in some cases above 100 000 ft.) Different types of aircraft, however, are limited in their range of speeds and altitudes. A hovering helicopter cannot suddenly accelerate to three times the speed of sound. Neither can a supersonic jet hover at 60 000 ft. A characteristic of an aircraft echo on a PPI is therefore its relative uniformity of movement. To monitor this movement allowance must be made for fades. The direction of movement also will be quite independent of wind direction at flight level.
Oiseaux et insectes
Satellites et débris spatiaux
Certans des plus grands objets fabriqués par l'homme dans l'espace (comme les ballons métallisés Echo I et Echo II, Pegasus, et les grands propulseurs) ont de grandes sections de coupe radar et peuvent être détectés par des radars de recherche n1[cependant les radars de recherche sont orientés vers des altitudes basses au-dessus de l'horizon et manqueraient donc les satellites lorsqu'ils sont à de hautes altitudes]. Par exemple, Peterson, (1960) a trouvé qu'occasionnellement la section de coupe radar de Sputnik II approchait 1000 m2. De tels objets spatiaux à des altitudes d'environ 120 miles à a des vitesses de près de 18 000 miles/h pourrait apparaître comme des multiples trip echoes if they were detected on a search radar.
Fig. 6 illustrates the possible appearance of the track of a satellite on the PPI of a search radar. The figure assumes a satellite at 120 n. mi. altitude moving radially at a distance of 500 n. mi. from a radar with an unambiguous range of 200 mi. (The elevation angle of the satellite would be about 8° which is within the vertical coverage of many search radars.) When the satellite is at point A the echo is displayed on the PPI at point A', 400 mi. less than the actual range. As the satellite moves to point B its range closes to less than 450 mi. so the echo moves to within 50 mi. on the PPI. From B to C the range of the satellite opens to 500 mi. so the echo moves out to 100 mi. again. An interesting feature of this example is that while the actual path length from A to C is 500 mi. the length of the echo track is only 140 mi. Thus, if the satellite was moving at 18,000 mph the echo would move only 140/500x18,000 or 5,040 mph. At the speed of 18,000 mph the satellite would move 5 mi/sec and take 100 sec. to move from A to C. It is obvious that the rotation rate of the antenna would have to be high to map the entire track of the satellite as it moved from A to C. An antenna rotating at 6 rpm would detect the satellite every 10 sec. and thus get an echo 10 times as the satellite moved from A to C. At slower rotation rates fewer points along the track would be displayed.
Detection of satellites by search radars would therefore result in high-speed echoes on the PPI. If the satellite were moving toward the radar the echo would move at the satellite velocity but would probably be detected for a shorter period since as it approached the radar it would rise above the vertical coverage of the radar beam.
Phénomènes d'ionisation
J. J. Thomson a montré que des particules ionisées sont capables de
disperser des ondes électromagnetiques. Des sources de particules ionisées incluent les tracés de foudre, les météores, les véhicules de réentrée, les décharges
coronaires de lignes de haute tension, et les décharges statiques d'appareils à haute vitesse. Les couches
ionosphériques et l'aurore sont aussi des phénomènes d'ionisation. Ces phénomènes d'ionisation ou plasmas pourraient
dans certaines conditions produire des échos radar sur le PPI d'un radar de recherche typique.
a montré que des particules ionisées sont capables de
disperser des ondes électromagnetiques. Des sources de particules ionisées incluent les tracés de foudre, les météores, les véhicules de réentrée, les décharges
coronaires de lignes de haute tension, et les décharges statiques d'appareils à haute vitesse. Les couches
ionosphériques et l'aurore sont aussi des phénomènes d'ionisation. Ces phénomènes d'ionisation ou plasmas pourraient
dans certaines conditions produire des échos radar sur le PPI d'un radar de recherche typique.
Plasmas resulting from lightning discharges return echoes which may be seen on the PPI if the operator is looking at the right spot at the right time. A number of investigators (Ligda, 1956; Atlas 1958a) have discussed the appearance of lightning echoes on the PPI. The echoes typically vary from a point to irregular elongated shapes up to 100 mi. or more in length.
A salient feature of lightning echoes is the short duration of the echo from a given lightning discharge. Since the echo lasts about 0.5 sec., it will be evident only on one scan.
The radar cross-section of the ionized column of plasma produced by lightning has been estimated by Ligda (1956) to be 60 m2 depending on ion density within the plasma and on the wavelength of the radar illuminating the plasma. Electron densities of 1011/cc are required for critical (100%) reflection of 3 cm. radar energy; only 109 electrons / cc are required with a 30 cm. radar. Thus, longer wavelength radars are more apt to detect lightning than the shorter wavelength radars. There is another factor which aids lightning detection at longer wavelengths. The longer wavelength radars detect less precipitation than the shorter wavelength radars. Therefore, a lightning discharge inside an area of light precipitation might be hidden within the precipitation echo on the PPI of a 3 cm. radar, while a 23 cm. radar might detect the lightning-produced plasmas but not the precipitation.
Confirmation that short-lived (one scan) echoes were caused by lightning was based on the fact that there were visual lightning discharges in the area from which the radar received the echoes. Atlas (1958a), however, estimated (from echo intensities and dimensions) that discharges may occur that are radar detectable, but are not visible to the eye. Whether or not there is visible lightning in the area of these short echoes, there will undoubtedly be precipitation areas in the vicinity. The exact distance from precipitation that lightning may occur has not been adequately studied. It is known that the probability of radar detection of lightning is greatest when the radar beam intercepts the upper levels (ice crystal regions) of thunderstorms. In a mature thunderstorm the ice crystal blowoff or anvil may extend many tens of miles downwind of the precipitation area. Atlas (1958a) illustrates a lightning echo some 10 to 20 mi. ahead of the precipitation echo but within the anvil cloud extending downwind from the storm.
In addition to short duration lightning strokes there is the longer-lived "ball lightning." Ritchie (1961) mentions the controversy surrounding ball lightning and also some of its alleged characteristics such as sliding along telephone wires, fences, or other metallic objects. Radar detection of ball lightning under these conditions is difficult since echoes of the metallic objects and the ground would tend to mask ball lightning near the surface.
Since search radars can detect echoes of very short duration returned by plasmas created by lightning flashes, there is no reason to assume that other plasmas could not be detected by search radars if the plasmas were sufficiently separated from other targets. The radar echoes would probably appear as point targets and if the duration were sufficient to compute a speed, it would correspond to that of the plasma. The possible range of speeds of plasma blobs cannot be given since so little is known about the phenomenon.
In addition to reflections of the radar pulse there is another source of signals from the lightning discharge, those that are radiated by the lightning discharge itself. These signals, called sferics, appear on the PPI as radial rows of dots, as one or more short radial lines, or as a combination of dots and lines (Ligda,1956). Atlas (1958b) states that 10 cm. and 23 cm. radars are good sferics detectors while radars such as the 3 cm. CPS-9 have moderately low range capabilities in detecting sferics.
As with the lightning echo, the sferic duration is very short Atlas (1958b) found an average 480 microseconds for 489 sferics measured during a severe squall line on 19 June 1957. As a result such sferic signals from a given lightning discharge would only be displayed on one scan of the PPIL.
The aurora is a complex phenomenon caused by ionization of the upper atmospheric gases by high-speed charged particles emitted by the sun. Upon entering the earth's upper atmosphere, these charged particles are guided by the earth's magnetic field and give rise to a luminous display visible only at night. The aurora occurs most often in the vicinity of 67° geomagnetic latitude. In the zone of maximum auroral activity, visual displays can be seen almost every clear night.
Increased auroral activity is found to follow solar magnetic storms. A direct correlation exists between sunspot activity and the intensity and extent of aurora. The increased auroral activity follows a solar disturbance by about one or two days, the time required for the charged particles to travel from the sun to the earth. During these times, auroras may be seen at latitudes far removed from the normal auroral zones.
Auroral displays occur in the ionosphere at altitudes ranging from 54-67 mi. The ionization which is seen as a visual auroral display is formed into long slender columns which are aligned with the earth's magnetic field. This formation results in strong aspect sensitivity which means that radar reflections occur only when the radar beam is approximately at right angles to the earth's magnetic field. Echo strength is proportional to the radar wavelength raised to the third or fifth power; consequently, most radar observations occur at VHF or lower UHF.
As a result only lower frequency UHF search radars within 1000 mi. of the Arctic or Antarctic Circles would be capable of detecting auroral echoes. The echoes would generally appear at true ranges of 60 - 180 mi. for a few minutes to several hours. The echoes would be mainly stationary and could be either distributed or point targets usually in the magnetic north azimuths in the northern hemisphere or magnetic south azimuths in the southern hemisphere.
Meteors are small solid particles that, when they enter the earth's atmosphere, leave an ionized trail from which radar echoes are returned. The majority are completely ablated at altitudes ranging from 50 - 75 mi. Visible meteors vary in size from about 1 gm. to about 1 microgram. The ionized trail produced by a 0.1 gm. meteor is miles long and only a few feet in diameter.
The meteor particle itself is far too small to be detected. Meteors are observed both visually and by radar by the trail of ionization they produce. Because of the distance and the small cross-section of the trail, meteor ionization can be detected by radar only when the trail is orientated at right angles to the radar beam.
Although most meteor echoes last no more than a fraction of a second when observed with VHF radar, a few echoes persist for many seconds. The duration of the meteor echo is theoretically proportional to the square of radar wavelength, and the power returned is proportional to the wavelength cubed. For these reasons, meteor echoes are seldom detected at frequencies above VHF.
Meteor echoes on a low frequency UHF radar usually appear as point targets with a duration of a few seconds or less. Ranges center around 120 mi.
Very, very infrequently meteors occur that are large enough to survive atmospheric entry. They usually produce a spectacular visual display, referred to as fireballs. Such meteorites are detectable by sensitive search radars operating at any frequency and at any angle to its path. Echoes appear as point targets with a duration of a few seconds. The true range would be less than 120 mi. and the range rate generally would be less than 20 000 mph.
Ballons
Les ballons et paquetages d'instruments ou réflecteurs transportés par les ballons peuvent être détectés par les radars de recherche. Plus de 100 ballons sont lâchés au-dessus des Etats-Unis au moins 2 fois par jour depuis le Bureau Météo de la Marine et des Stations de l'Air Force pour la mesure des conditions de haute atmosphère. Un certain nombre de ces ballonstransportent des réflecteurs radar en plus d'un paquetage d'instruments, et certains sont éclairés pour un suivi (visuel) au théodolite. Les échos de ces cibles ponctuelles se déplaçent à la vitesse du vent à l'altitude du ballon. Les altitudes de ballon varient largement et pourraient atteindre 100 000 pieds de sorte que les vitesses au sol varient de 0 à bien plus de 100 noeuds. Lorsqu'un ballon explose et que le paquetage d'instruments commence brutalement une descente normalement ralentie par parachute, il pourrait y avoir un changement brutal dans le comportement de l'écho sur le PPI. Un ballon qui s'est élevé dans une direction loin de la station montrerait une portée progressivement croissante. Puis s'il descendait rapidement la portée pourrait sembler décroitre ce qui pourrait être interprété comme une inversion de course.
"Paillettes," "Fenêtre," et "Corde"
Lorsque le radar a été développé comme un moyen d'orienter les projecteurs et les tirs anti-aériens pendant la 2nde guerre mondiale, des countre-mesures ont été rapidement conçues. Le besoin était quelque chose de peu coûteux et dépensable qui fournirait un retour radar comparable à l'écho d'un appareil. De petites bandes de feuille métallique agissant comme des réflecteurs à dipôle furent employés. Les bandes sont lâchées d'un appareil, et dispersées au vent ce qui résulte en un nuage avec section de coupe radar comparable à un grand appareil.
Les termes "paillettes," "fenêtre," et "corde" sont utilisés pour désigner des types particuliers de matériel. Les paillettes consistent en diverses longueurs de matériau. Les paillettes ayant la même longueur sont appelées fenêtre. La corde est un long rouleau de feuille ou fil métallique pour une réponse large et à basse fréquence.
Des monofilaments de nylon métallisé ont remplacé la feuille de métal dans la construction des paillettes et des fenêtres. Le type en nylon est plus léger, et a donc un rythme de descente plus lent, et est plus compact. Un paquetage typique de paillettes X-band est un cylindre de 1 pouce de diamètre et de 1,5 cm (une moitié de la longueur d'ondes de 3 cm) de long. Le cylindre contient approximativement 150 000 filaments et pèse 6,5 g et forme un nuage avec une section de coupe radar de 25 m2 environ. Les filaments descendent à environ 2 pieds/s dans de l'air immobile à des altitudes plus basses, de sorte que s'ils sont distribués à 40 000 pieds ils mettent près de 4 h pour atteindre le sol. Les turbulences amènent le nuage de paillettes à croître et se disperser, de sorte que généralement le signal devient si affaibli que parfois le nuage de paillettes ne peut être suivi sur tout son chemin jusqu'au sol.
Les paillettes contenant un grand nombre d'éléments, le signal radar est semblable à celui de précipitations. Il se déplace également comme le vent à son altitude. Par conséquent, il est difficile de distinguer des précipitations d'un nuage de paillettes en examinant brièvement l'affichage PPI. Lorsque les paillettes sont distribuées le long d'une trajectoire relativement étendue par opposition à une distribution qui ne serait que ponctuelle, l'écho est allongé et apparaît différent de précipitations.
La corde est un morceau de 60 à 80 pieds d'un matériau métallisé étroit comme le mylar. Il est lesté à une extrêmité et a un mécanisme de dérivation à l'autre. Une fois déployé il a un rythme de descente d'environ 2 fois plus rapide que les paillettes et il lui faudra donc environ 2 h pour tomber de 40 000 pieds à la surface. Généralement un certain nombre d'éléments de corde sont déployés ensemble et il y aura donc une augmentation de la taille du nuage à mesure qu'il descend.
Fumée
Hiser (1955) rapporte avoir détecté de la fumée de feux dans la décharge municipale à environ 15 miles du site d'un radar de recherche de 10 cm. L'écho radar from the smoke plume was evident on the PPI extending in a northeasterly direction to a range of 50 mi. Goldstein (1951) mentions a case where an airplane was directed to an echo observed by a 10 cm. radar. Only several columns of smoke from brush fires were found. Smoke particle size and concentrations are so small that one would be highly skeptical about echoes from the smoke itself. The returns may arise from refractive index discontinuities at the boundaries of the smoke plume. Plank (1956) suggests that echoes from the vicinity of fires may be from either particles (neutral or ionized) carried aloft by convective currents or from atmospheric inhomogeneities created by the fire.
Distant Ground Return and "Angels"
Local terrain features and, at sea, the ocean surface are detected by radar. The range to which such clutter is detected is a function of antenna height, elevation angle and beamwidth, and the distribution of temperature and humidity along the propagation path.
Since normal ground clutter is present day after day, radar operators become familiar with it arid may even use some prominent points to check the azimuthal accuracy of the radar. There are circumstances in which distant, rarely detected terrain features or surface objects return echoes to a radar. The phenomenon referred to as "angels" is also included in this section since at least some of the angels appear to be distant ground return that is detected by reflection or forward scatter of the radar beam by atmospheric inhomogeneities.
To investigate the phenomena of distant ground return it is first necessary to review some of the fundamentals of the propagation of electromagnetic radiation through the atmosphere. The interested reader can find a comprehensive treatment of tropospheric radar propagation in a book on radio meteorology by Bean (1966) which covers in detail the topics in the following brief review.
In a vacuum, electromagnetic energy is propagated in straight lines at the velocity of light, 3x10⁸ m/sec. This constant is usually designated by the symbol "c." In a homogeneous medium, the direction of propagation remains constant, but velocity (V) is reduced and
 (1)
(1)
where mu is the magnetic permeability of the medium and kappa is its dielectric constant and
where n is the index of refraction.
When electromagnetic wave energy encounters a surface of discontinuity in refractive index in a medium, the wave is partly reflected and partly refracted ].
The angle of the incident ray (theta) is related to the angle of the refracted ray (theta') by the equation:
 (2)
(2)
where theta and theta' are the angles of incidence and refraction respectively in the first and second medium, and n and n' are the values of the refractive index for the first and second medium respectively.
The ray is always refracted towards the medium of higher refractive index. A portion of the energy will also be reflected in the same plane and at an angle equal to the angle of incidence if the energy encounters a sudden change in the refractive index; this is a partial reflection. Total reflection occurs when the angle of incidence exceeds a critical value given by (with n1 < n) :
 (3)
(3)
NCAS Editors' Note: this formula appears to be incorrect in the original manuscript, and should probably have been:
 (3)
(3)
In the atmosphere, discontinuities in refractive index sharp enough to cause reflection of the incident wave back to the radar are believed to exist on occasion. Because of the difficulty in making suitable measurements of the physical factors involved, some uncertainty attends the understanding of this mechanism under practical conditions. Detailed discussion of this aspect of propagation is deferred until later where radar 'angels' are described. In the present context, discussion of the effects of refractive index inhomogeneities will be confined to refraction.
Where the refractive index gradient is changing continuously as is normally the case in the natural atmosphere as the height above the earth's surface increases, a ray of electromagnetic energy will follow a curved path. The change of direction that this produces may be evaluated by reference to Snell's law by the expression :
where nh is the refractive index at height h, ns is the refractive index at the surface, a is the radius of the spherical earth, beta is the ray elevation angle at height h and beta0 is the ray elevation angle at the earth's surface (See Fig. 7).
A most important consequence of this is that the effects of a vertical gradient of refractive index are most apparent at low (10° or less) angles of elevation.
Where the refractive index gradient is constant
In terms of the real atmosphere, at radar frequencies the refractive index varies as a function of pressure, temperature, and water vapor content. An equation relating the various parameters as given by Smith (1953) is:
|
|
77.6P
T |
+ |
T2 |
(5) |
où :
- P = total pressure (millibars)
- T = absolute temperature (degrés Kelvin)
- e = partial pressure of water vapor (millibars)
When the available data are given in terms of relative humidity, e may be replaced by es R.H., where es is saturation vapor pressure at the pressure and temperature of interest and R.H. is relative humidity expressed as a decimal.
For convenience, the left hand side of the equation is commonly designated N (refractivity) and is expressed in equation is commonly N-units, i.e., N = (n - 1) 106.
Values of N are conveniently derived from meteorological parameters by the use of tables or nomograms, such as those given by the U.S. Navy (1960).
At sea level, a typical value of n is 1.00035, i.e., the refractivity is 350 N units. But depending upon pressure, temperature and humidity the sea level refractivity may range from 250 to 450 N units.
Since pressure, temperature, and water vapor normally decrease with height the refractivity normally decreases with altitude. In a 'standard' atmosphere, typical of temperate latitudes (with a thermal lapse of 2°C/1000 ft. and uniform R.H. of 63%, the gradient (lapse rate) of refractivity is 12 N-units/l000 ft. 39 N. km-1 in the lower levels. For a constant gradient of this magnitude, a ray will have a curvature of about 1/4th that of the earth's surface (the radar horizon in this case is about 15% further than the geometrical horizon). For short distances the geometry is equivalent to straight-line propagation over an effective earth with a radius 4/3 as large as the true earth.
A device frequently used to facilitate the consideration of propagation geometry and radar coverage takes advantage of this fact. If a fictitious earth radius is adopted that is 4/3 the earth's true radius, radar rays in the standard atmosphere may be drawn as straight lines, which will preserve the same relationship to the redrawn earth's surface as is the case in reality.
| Atmosphère | dN/dz typique | Rayon de la terre effectif pour dN/dz typique |
|---|---|---|
| Standard | -12 N-units/1000 pieds ; -39 km-1 | 1,33 de rayon effectif |
| Sub refractive | +10(>0); +33 km-1 | 0,82 |
| "Normal"* | -15 (0 à -24); -50 km-1 | 1,47 |
| Superrefraction | -30 (24-48); -100 km-1 | 2,68 |
| Trapping | -48 (ou plus); -157 km-1 | presque infini (ou négatif ; i.e., terre concave) |
In atmospheres having different constant gradients of refractivity appropriate factors may be applied to the earth's true radius to accomplish a similar result. Typical values ire given in Table 5.
*For an average temperate zone climate; northern climates (e.g. England) tend to be "standard," tropical climates tend to be near-superrefractive (e.g. -80 km-1).
It is important to recognize the limitations of this device, for even in standard atmospheres initially horizontal rays rapidly reach higher atmospheric levels, at which the refractivity gradient can no longer be represented by the same constant. Again, as will be discussed below, atmospheric conditions frequently depart from the "standard" conditions. The effect of variation in the refractivity gradient on the curvature of radar rays is shown in Fig. 8. Apart from showing the range of curvatures in atmospheres having constant refractivity gradients, this figure indicates the way in which rays can be deflected in passing through atmospheric layers. More specifically, the deflection of a ray in milliradians (Delta tau) in passing through a layer with constant N-gradient is given by :
 (7)
(7)
where the subscripts B and T refer to the bottom and top of the layer respectively. The values of beta are determined at each level in terms of beta0, Ns (surface refractivity), Nh (refractivity at height h) and h, using Snell's Law (equation 4).
Procedures based on these relationships may be used to trace the path of rays to determine the detailed effect of refraction on radar propagation under any given condition of atmospheric stratification.
The broad pattern of refractive effects, however, is as follows:
- Where the general refractivity gradient lies between 0 N-units/l,000 ft. and 24 N-units/l,000 ft. (100 km-1) propagation is described as normal.
- Refractivity gradients less than 0 N-units/1,000 ft. are subrefractive and cause upward bending of radar waves with a reduction of distance to the radar horizon. Such conditions may occur where the temperature lapse rate is well above average, or where the atmosphere is drier at lower levels than aloft.
- Where the refractivity gradient exceeds 24-N units/1,000 ft. conditions are said to be superrefractive and radar waves curve down more strongly. Such conditions result from thermal inversions, i.e., where temperature increases with height, or where the decrease of water vapor content with height is excessive.
![Figure 9 : Passages de rayons à travers [ducts]](/time/1/9/6/8/CondonReport/s3/c5/s6c05f09.gif)
For refractivity gradients greater than 48-N/l,000 ft. (157 kin1), the ray curvature will be greater than that of the earth's surface and trapping is said to occur.
This condition gives rise to marked anomalies in propagation and, provided the layer through which such a gradient occurs is deep enough, the radar energy will be guided within a duct bounded by the earth's surface and the upper level of the layer. In such cases, exceptionally long detection ranges are achieved, well beyond the normal radar horizon (See Fig. 8). Where a marked negative refractive gradient occurs in a layer adjacent to the ground, a surface duct is formed (Fig. 9a). An elevated layer of strong negative gradient can also produce ducting (Fig. 9b).
Surface ducts are commonly caused by radiative cooling of the earth's surface at night, leading to a thermal inversion in the air near the surface. In this case, the extreme refractivity gradient is mainly due to temperature effects and such ducts can occur in quite dry air. Where humidity at the surface is higher than usual and falls off rapidly with height, a strong negative refractivity gradient is also established. Evaporation from water surfaces or wet soil can produce these conditions and a particularly common example occurs in warm dry air from the land when it is advected over the sea. This type of duct is commonly found in tropical areas, where temperature and humidity both decrease with height; the inversion type of duct is more common in temperate and artic areas (Bean, 1966).
Elevated layers of extreme refractivity gradient are caused by similar meteorological mechanisms but often occur on a somewhat broader scale. Certain areas of the world are particularly prone to such layers; the California coastal area is a good example. Plate 66 (Blackmer, 1960) shows an example of the PPI during a trapping situation off the California Coast. In this case echoes were presented on the PPI on second and third sweeps but could be correlated with islands and mountainous terrain. Elevated layers such as this are commonly found in the southeast (northeast at S latitudes) quadrants of trade-wind anticyclonic systems.
The anomalous propagation to which such irregular refractivity conditions give rise is of considerable significance to the problem of target identification and false targets. In the first place, the whole basis of the radar technique depends upon knowing the direction in which the radar energy is propagated. For normal practice, propagation must be close to rectilinear. When the radar energy is being strongly curved, information on a target's location derived from the position of the radar antenna can thus be highly erroneous. Again, echoes may be received from the ground or from other targets that are not normally within the range of the radar or within its 'field of view' at any given antenna elevation. Ground echoes from beyond the normal radar horizon are cases in point.
An especially significant condition arises when the antenna is elevated in a direction which is near a critical angle for trapping or ducting. In this case, while much of the energy may be propagated in a direction approximating that intended, because of the finite dimensions of the radar beam, some energy may be severely refracted. This is illustrated diagrammatically in figure 10.
With such a mechanism an aircraft could be tracked fairly accurately, but in addition, echoes could be received from the ground (intermittently if the surface reflectivity or propagation conditions are variable as might be the case in areas of thunderstorms). Such echoes would be displayed as though they were due to targets seen at the angle of elevation of the antenna, and thus at heights which would depend upon their range. A great variety of such possibilities can occur depending upon the geometry involved, the refractive conditions, and the nature of the terrain.
The range of possibilities is further extended if the distribution of radar energy in the side lobes is taken into consideration. With a side lobes strength 30dB below the main beam (a factor of 1000 in power), a side lobes target will yield a return equal in strength to the main beam return of an identical target at a range 5.6 times greater (the 4th root of 1,000). Thus a target detectable at 100 mi. in the main beam might be detected by the (first) side lobes at a range of up to 18 mi.
Anomalous propagation of the type described is also significant in determining the distribution of energy within the envelope of the main beam, particularly in broad vertical beam systems. At low angles some energy within the beam impinges on the earth's surface near the radar and is reflected, still within the envelope of the beam. Because the path followed by such energy is necessarily longer than the direct path and because of the wave nature of the energy, in-phase and out-of-phase interference will occur, leading to a vertical lobe structure in the beam envelope (see Fig. 10). Anomalous propagation conditions can readily produce variations in the normal distribution of energy within the beam due to this mechanism and thus can easily lead to unexpected variations in signal intensity from distant targets.
It is important to recognize the difficulties that are inherent in establishing whether propagation conditions are anomalous in certain cases. Where the gradient of refractivity extends uniformly over large horizontal areas, there is little difficulty in determining the situation either from conventional meteorological data or from the manifestation of the anomalous performance of the radar itself (for example, the detection of ground clutter to abnormally large ranges). In some cases it is possible to infer, with some confidence, from the meteorological conditions (especially if data on the vertical profile of temperature and humidity are available) that anomalous propagation is not present. In many cases, however, the causative conditions may be very variable in space and time, and it is then difficult to be at all confident about the nature of propagation at any particular time or in any particular place. Even if timely radiosonde data are available from a nearby location, the information they provide on the thermal and humidity gradient is often inadequate for the assessment of the refractive conditions. In particular, special experimental observations have shown that shallow layers of abnormal refractivity commonly occur either close to the surface or at various levels aloft.
It is often possible to infer only the likelihood or improbability of anomalous propagation conditions by reference to the general meteorological conditions that prevail. Thus one would expect normal propagation in the daytime in a well-mixed, unstable airstream with moderate winds over a dry surface, while expecting marked superrefraction over moist ground during a calm clear night following the passage of a front that brought precipitation in the late afternoon.
Localized conditions favorable for superrefraction are also caused by showers and thunderstorms (Ligda, 1956). The cold downdraft beneath thunderstorms can cause colder air near the surface than aloft while evaporation from the rain and rain-soaked surface, causes locally higher humidities.
In addition to the detection of distant ground targets by refraction of the radar beam, there is the possibility of reflection or forward scatter of the beam to ground targets. Whether or not layers that would reflect the beam to-the ground would also be detected by the radar has been part of the controversy concerning the nature of invisible targets in clear air. These so-called "angel" echoes have been observed since the early days of radar (Plank, 1956; Atlas, 1959 and 1964; Atlas, 1966a). Detailed case studies of selected angel situations illustrate the difficulty of determining the nature of the targets causing the angel echoes. For example, Ligda and Bigler, (1958) discuss a line of angel echoes coincident with the location of a cloudless cold front. They discuss the likelihood that the line was due to differences in refractivity between the two air masses or to flying debris, leaves, paper, small twigs, birds, insects, etc., carried aloft by turbulence during the frontal passage. Although surface weather instruments recorded a drop of 13°F in less than an hour, this sharp temperature change together with the change in both vapor pressure and atmospheric pressure did not appear to be sufficient to cause gradients of refractivity of sufficient strength to produce the observed echo line. In spite of this difference between refractivity gradients based on surface observations (of pressure, temperature, and moisture) and those required to explain the source of the echo) Ligda and Bigler found serious objections to any hypothesis other than that the echo was due to refractivity gradients. They mention the need for instruments capable of measuring sharp refractivity gradients.
Atlas (1959) studied in detail a situation at Salina, Kans. on 10 September 1956 where cellular and striated echoes covered much of the PPI to ranges of 85 mi. He concluded that the echoes were due to forward scatter from a patterned array of refractive index inhomogeneities to ground targets and back. Recently Hardy and Katz (1968) discussed a very similar radar pattern. They concluded that insects were responsible for the echoes and that cellular pattern of insects was due to atmospheric circulation. Atlas (1968c) agreed that insects may be responsible for some echoes but that the forward scatter explanation is valid in other instances.
Investigations of angel echoes with high-power, high-resolution radars at three different wavelengths have made it possible to learn much about the nature of targets producing various types of angel echoes. Simultaneous observations at 3 cm., 10.7 cm., and 71.5 cm. with the ultrasensitive MIT Lincoln Laboratory Radars at Wallops Island, Va. have been described by Hardy, Atlas, and Glover (1966) , Atlas and Hardy (1966a), and Hardy and Katz (1968a). They found two basic types of angel echoes: dot or point echoes and diffuse echoes with horizontal extent. The dot angels are incoherent at long ranges or when viewed with broad beams but are discrete coherent echoes when viewed by a radar with high resolution. They may occur in well defined layers and may have movements different from the wind at their altitude. Their cross-sections and wavelength dependence are consistent with radar returns to be expected from insects. Since no other explanation fits all the observations of these dot angels, it is concluded that the targets are insects.
Extensive diffuse echo layers have been noted at a variety of heights and sometimes exhibit an undulation or wave motion. The height of these layers coincides with levels at which refractive inhomogeneities may be expected, e.g., at the tropopause. It can be shown theoretically (as summarized by Hardy (1968b) that the measured radar reflectivity of such layers accords well with the theory of the scattering of electromagnetic energy by dielectric inhomogeneity due to Tatarski (1966). The reflectivity (eta) is related to wavelength (lambda) and the coefficient C2 which describes the degree of refractive inhomogeneity due to turbulence, by the expression
![]() (10)
(10)
from which it will be seen that such layers are more likely to be detected by radars operating at shorter wavelengths. Although, because this simple relationship does not apply in the dissipation range of the turbulence spectrum the largest values of n occur at about 5 cm (Atlas 1966b). These phenomena have been much studied recently in connection with the detection of clear air turbulence. (Hardy, 1968b; Ottersten, 1968: and Atlas, 1968b). It is concluded that such turbulence may be detected with ultra high performance radars but only when well marked. (Note that the significant physical feature detected, i.e., the dielectric inhomogeneities, is caused in these cases by the turbulent condition of the atmosphere.)
Radars of the type normally used for tracking and surveillance are unlikely to detect such layers. On the other hand, it has been suggested that on occasion at low levels where marked intermixing of dry and moist air is present, dielectric inhomogeneities will be sufficiently marked and be present in sufficient quantity to produce detectable echoes with radars of relatively modest performance.
Measurements made by Atlas (1953, 1959) and others indicated that atmospheric layers occasionally exist having power reflection coefficients, at normal incidence, of 10-14 or greater (i.e., 140 db attenuation). The power reflection coefficient of such layers would be greatly magnified if the radar energy impinged on the layer at a small grazing angle. The increase is roughly proportional to the 6th power of the cosecant of the grazing (i.e., elevation) angle. Thus at a grazing angle of about 10 mrad, the reflected signal would be as high as 10-2 (a 20 db attenuation). Under actual atmospheric conditions the partially reflected signal of ground objects for example, would be expected to be detectable only at grazing angles (and thus, initial elevation angles) low enough to produce return signals above the noise threshold of the radar receiver. This would produce a "forbidden cone" effect, where no such anomalous signals would be detected closer than a certain range (because of elevation angle, range relation of a layer at a constant height); this has been actually observed in several cases (see Section III, Chapter 5).
It is conceivable that there could be rare occasions when only isolated atmospheric inhomogeneities existed or when the inhomogeneities were such that only the most reflective ground targets were detectable. In such situations only one or two unusual ground targets would appear on the PPI. Levine (1960), dans une discussion sur la cartographie par radar, met en avant comment certaines combinaisons du sol et de structures construites par l'homme agissent comme des "réflecteurs de coin" et retournent un signal plus fort au radar qu'il n'est renvoyé par les caractéristiques environnantes. Les côtés des bâtiments et adjacent level terrain, or even fences and level terrain, constitute such reflectors. He states that in areas where fences and buildings are predominantly oriented north-south and east-west, the 'glint' echoes from the corner reflector effect appear at the cardinal points of the compass and have therefore been called a "cardinal point effect." In addition, different types of vegetation have different reflectivities and these vary further according to whether they are wet or dry.
From the above discussion it is obvious that the identification of targets as being ground return due to forward scatter or reflection is difficult in any but the most obvious situations. Still it should be realized that situations do occur when only very localized areas of ground return may be detected and due to the detection mechanism the location of the intersection of the radar beam with the ground may vary from sweep to sweep of the radar antenna. The problem of verifying whether the target is ground return is greatly complicated by the fact that measurements of refractivity gradients cannot currently be made in sufficient detail around the radar site to describe with precision the medium through which the radar beam is being propagated.
Radio Frequency Interference
During the past 15 years, electromagnetic compatibility (EMC) has emerged as a new branch of engineering concerned with the increasing problems of radio frequency interference (RFI) and the overcrowding of the radio frequency spectrum. The EMC problem is increasing so rapidly that considerable engineering efforts are included in the design, development, RFI testing and production of all new electronic equipment from the electric razor and TV set to the most sophisticated of electronic equipments, such as computer and radar systems. This is true for entertainment, civil, industrial, commercial, and military equipment. The problems are compounded not only because the frequency spectrum is overcrowded, but much earlier generation equipment, which is more susceptible to and is a more likely source of interference, is not made obsolete or scrapped. New generation equipment is potentially capable of interaction problems among themselves, as well as playing havoc with older equipment. Each year sees new users bringing new equipment into the frequency spectrum: such as UHF television, garage door openers, automatic landing control systems, city traffic management and control systems, and a vast array of new electronic devices being introduced into tactical and strategic defense systems.
RFI contributes to the information displayed on radar scopes. It is caused by the radiation of spurious and/or undesired radio frequency signals from other non-associated electronic equipment, such as navigational aids, data processing computers, voice communication systems, other radars, and from more common sources, such as ignition and electric motor control systems. RFI can also be emitted from the radar system's own components, causing self-induced interference.
Much interference may be sporadic, producing only a short lived 'echo.' There may be instances, however, when the interference occurs at regular intervals that could nearly coincide with the antenna rotation rate so that the spurious echo' might appear to be in approximately the same position or close enough to it that the operator would assume there was a target moving across the scope.
Radio frequency interference can enter the radar system in many places:
- In the transmitter where it can affect the stability and fidelity of the transmitted output pulse waveform;
- In the receiver local signal-generating and amplifying circuitry where its effects can be similar to the transmitter perturbations;
- In the external transmitter/receiver space link where the interference effectiveness depends upon its intensity, frequency, power level, direction of arrival and signal spectral characteristics.
External interference entering on the link through the antenna input is the most common of these possible interference sources. Plate 67 shows some of the more easily recognizable radio frequency interference patterns from other radar systems. This type of interference considerably reduces the effectiveness of the radar, but this type of interference, taken alone, is usually readily identifiable by operating personnel. This might not be as true when it occurs in conjunction with extraordinary meteorological, propagation, and equipment degradation phenomena.
The photographs in Plate 66 are time exposures of the PPI. The camera shutter is left open for a full rotation of the antenna so the photograph is generated by the intensity of the cathode ray tube electron beam as it rotates with the antenna. This is in contrast to an instantaneous photograph that would be brightest where the trace was located at the instant of exposure and, depending on the persistence of the cathode ray tube, much less bright in other regions. While the interference in these photographs appears as lines it would appear as points at any given instant. The lines are generated by the time exposure as the points move in or outward along the electron beam. The photographs also show precipitation echoes. Examination of the photographs shows that the interference does not mask the larger precipitation echoes to any appreciable extent but might mask small point targets.
A radar receiver has a limited bandwidth over which it will accept and detect electromagnetic signals. In this acceptance band, the receiver reproduces the signals at the receiver output and displays them on the radar presentation display. Thus any interfering signals that fall within this band will be detected and displayed by the very sensitive receiver. In an S-band (2ghz) pulse radar, the typical bandwidth of the receiver will be 20 - 50 ghz. Any weak signals in this frequency band will be detected. Even out-of-band signals can interfere if they are of sufficient signal intensity to overpower the receiver out-of-band rejection characteristics. For instance, a very strong out-of-band signal of 10 watts might be typically attenuated by the receiver preselection filter by 60 db, reducing it to a signal of -20 db. To the radar receiver, this can still be a powerful signal, as it might have a sensitivity of displaying signals as weak as from -50 to -80 db or less. It is also likely that the out-of-band interference will be derived from the nonlinear interaction of the desired return signal and the out-of-band interfering signal. The resulting interaction (mixing) of these signals in the receiver can generate still weaker intermodulation products that fall within the passband of the system circuits so that they are displayed. Spurious responses can occur at other than the frequency to which the radar is tuned because of inadequacies in the rejection of the unwanted frequencies in the receiver. The inadequacy is caused by insufficient out-of-band filter rejection coupled with a high level of RFI.
Increasingly more powerful transmitters and more sensitive receiver radar systems need even greater relative suppression of unwanted emission, to prevent the absolute level of out-of-band interference from rising to intolerable levels, thus causing interference to and from other electronic systems.
Even if normally operating radars are not affected by this interference most of the time, the degradation of the radar components or of nearby systems can cause the temporary increase in interference at the radar site. Radar personnel are continually concerned with this problem. Such acts as opening an electronic cabinet can cause the local RFI to increase sufficiently to create an RFI nuisance to the radar system.
Each radar system has been designed to fulfill a single class of target tracking function, being optimized to provide proper and reliable target data a high percentage of the time. However, all systems, including radar systems, have their limitations. Thus, it must be recognized that there will be times when other systems will interfere, component parts will either gradually degrade or catastrophically fail, propagation and meteorological conditions will deviate far from the normal environment, and maintenance and operating personnel will occasionally fail to function effectively. For all radar and other electronic systems, an increasing amount of effort is expended to reduce the occurrence of these degradations or failures and to minimize their effects.
Lobes and Reflections
Because of radar engineering design limitations, it is not possible to direct all of the transmitter energy into the main antenna beam and small but measurable amounts of energy are transmitted in many other directions. Similarly, energy can be received from such directions, in what are known as the side lobes of the antenna, and can give rise to erroneous directional information. Particularly complicated situations arise when side lobe problems are associated with building or ground reflection mechanisms. For example, if a radar antenna is radiating 100,000 watts peak power in the main beam, 100 watts can be simultaneously radiated from a -30 db side lobe in another direction. Fig. 11 (adapted from Skolnik, 1962) shows a radiation pattern for a particular parabolic reflector. Note that if the main beam is radiating 100 Kw, the first side lobe, the first minor and the spillover lobe radiate about 100 watts. This 100-watt radiation will be reflected from large targets in this side lobe heading but will be shown on the PPI as having the same bearing as the main beam of the antenna. This display of a false target is called a ghost. In this particular instance two targets having identical radar cross-sections would appear as returns of equal intensity if one were in the main beam and the other in the side lobe but 5.6 times closer to the radar.
Highly reflective targets can often be detected in the side lobes. Thus a single large target detected in the numerous side lobes can be displayed in a number of places simultaneously. Since, in radar displays, target echoes are represented as being in the direction in which the antenna is pointing, not in the direction from which the energy is returning at the time of the detection, side lobe echoes from a single target can be shown as a collection of false targets. Such target outputs from side lobe returns are generally systematically located in the display relative to the main beam return signal. Therefore, in general, side lobe return signals are readily identifiable by the operator and will tend to cause obliteration of other nearby target returns. Side lobe return signals usually bear a fixed relationship of adjacent blips on an arc about each side of the main target return. This is a common problem in ship radars where another ship is being scanned broadside. The highly reflective ship might have a return signal that will occur at the true range of the ship, but will be contained in an arc exceeding 10°or 15° instead of a single narrow blip.
Detection from vertical side lobes can cause strange effects when "radio dusting" is present. Many radars are constructed so that the antenna cannot be pointed at very low elevation angles, in order to avoid the most severe anomalous propagation effects or, more often, to avoid ground reflections. Assume, for example, a radar with a beam width of (nominally) 1°, having a minimum at say 1.5° and a side lobe at 2°. Assume also that the antenna is constrained to elevation angles of 1.5° or greater. If a surface duct is present, the strongest signals would be attained by pointing the antenna (and the main beam) at an elevation angle of 0°, but this cannot be done. However, ducted targets could be detected with the first (vertical) side lobe, and in this case the maximum AP signals (ducted) would be attained at an apparent elevation angle of 2° (so that the main side lobe was at 0°), and the intensity of these false target signals would decrease or even disappear if the antenna were lowered to its minimum setting of 1.5°. This sort of behavior has apparently led some investigators of specific UFO incidents to discount the possibility of anomalous propagation as the source of unknown radar targets.
Smith (1962) discusses the effects of side lobes on observed echo patterns during thunderstorms and periods of anomalous propagation. In both situations echoes were observed extending from the surface up to 70,000 ft. (the upper limit of the PHI scope). Before these vertical protrusions to high altitudes were observed during anomalous propagation conditions when the echoes were known to be from ground clutter, it was not realized that they were from side lobes. As a result, the side lobe echoes had not been recognized when measuring thunderstorm heights and reported heights were much too great. On the PHI side lobe, echoes took the form of narrow echo protrusions above the location of strong targets. These protrusions were often segmented due to nulls between side lobes, but in some cases were continuous.
One effect of such lobes is that when the antenna of a search radar is elevated (so that at longer ranges no ground return should be evident) ducted side lobe radiation results in echoes on the PPI. Without understanding what is happening, the operator would logically assume a strong target at high altitudes.
Angle of arrival measurements by a radar, like other measurement devices, will be limited in accuracy by noise and interference. Other limiting factors can be the reflection caused by the wave characteristics of electromagnetic radiation. Reflections from the ground in front of the antenna system or from a nearby building or mountain can be minimized by proper antenna location. These effects can seldom be reduced to zero and are detrimental to an extent that depends on the antenna lobe pattern, geographical, and extraordinary meteorological conditions, thus causing residual reflection problems.
Another phenomenon explaining strange and erratic radar returns has been observed with echoes occurring at locations where no targets are to be found. Analysis of these observations shows that the echoes are from ground or airborne objects which are being detected by radiation reflected from mirror-like plane surfaces of vehicles or buildings in the neighborhood of the radar. If the reflector is moving, then the reflected ground target behaves like a moving target.
It changes its apparent distance and direction relative to the radar. The double reflecting return echo is shown in the PPI display in the direction at which the first reflecting surface is found. The echo may, however, be displayed at a point at which there is no actual target. Moving objects, such as automobiles or other objects capable of reflecting electromagnetic waves may be obscured on the PPI by ground clutter so they are not identified. It is obvious that ghost echoes can show movement which is not possible with real vehicles. Many unusual PPI observations have been explained in this manner.
Mechanisms of multiple reflections which serve to produce ghosts are illustrated in Fig. 12. These involve specular reflection from the first target, effectively deflecting a significant amount of radar energy to a second target at a different azimuth, which is oriented so as to reflect most of the radiation incident on it. Either of the reflecting targets can be stationary or moving objects. In Fig.12 the radar is at the point labeled "1." A reflector is a point "2" and real targets are at the points labeled "3." Due to reflections from the reflector to the targets, ghost echoes will appear at the points labeled "4." The appearance of the ghost on the PPI is one possible explanation for perplexing unidentified target motions. If one of the two reflectors is an aircraft and undertakes any maneuvers, the path followed by the ghost is especially erratic. As viewed on a PPI scope perhaps it first recedes from, then "flies" parallel to, and finally overtakes or appears to collide or pass the real aircraft.
La Fig. 13 (adaptée de Levine 1960) montre la trace of a conventional aircraft surveillance radar PPI (included within the circle). The solid line (A) shows the return echo path of an aircraft traveling at 300 knots. The dashed line (B) shows the echo path that will also result when sufficient radar energy is scattered from the aircraft to a prominent ground reflector located at C, and then reflected back to the aircraft and then to the receiver. In this example, the aircraft is the first of the reflectors, so that the phantom echo always occurs at the same azimuthal bearing as the aircraft, while its range always exceeds that of the aircraft.. Consequently, on the PPI, the path of this ghost always lies outside the aircraft path. However, if the aircraft overflies the ground object, the phantom echo and the aircraft echo will almost merge. In addition, as the apparent range of the phantom is greater with the same radial speed as the aircraft, the apparent velocity of the ghost will be magnified by the ratio of the aircraft-to-phantom distance from the radar. The phantom can appear to exceed 2,000 knots in this manner. In Fig. 13 the ghost is moving at 900 knots along a portion of the ghost track.
Fig. 13 and the discussion above relate to the case when the aircraft is the first of two reflectors. For the conditions with the ground object as the first of the two reflectors, the phantom echo always occurs at the same azimuth bearing as the ground object. For example, in Fig. 14 (également adaptée de Levine, 1960) the solid line (A) applies to scattering from the first reflector to the aircraft and back to the receiver. The inward and outward excursions of this path actually occur along a single radial line from the radar site through the first reflector.
In any actual situation, only fractional portions of the ghost echo paths might be of sufficient signal strength to appear on the display. Those particular returns that are closest to the ground object or where the reflector has the most favorable reflecting properties will most likely be displayed. In a radar detecting only moving targets, a stationary ground object might not appear as a target on the scope. Thus, in this manner, the operator's ability to correlate ghosts to a reflecting surface is considerably reduced, especially when many known targets are on the display. From Figs. 13 and 14, it is shown that the phantom echo fell outside the display and then returned during a later portion of the flight. Thus, if only portions of the phantom track are a detectable signal, and if (this would usually be the case) there are several targets on the display at once, the operator would find it very difficult to discern whether the phantom was real or ghost. He is concerned about the erratic behavior of a target, but he is most concerned by the potential and displayed near-misses to known targets.
In general doubly reflecting ground targets must be of sufficient size and have good radar-reflecting properties to serve as radar reflectors. Reflectors can be moving or stationary. Reflectors that fit this description include sloping terrain, sloping metal roofs, metal buildings, nearby ground structures, or large trucks and trailers.
Fig. 13 illustrates the possible sporadic nature of reflection echoes. Plate 68a, taken when stratiform precipitation was occurring, documents the fact that there is a sector to the east that is blocked by some object. Plate 68b shows normal ground clutter plus a few probable aircraft. Plate 68c shows the appearance of the PPI when anomalous propagation was causing more extensive ground clutter. In this photograph there is an echo in the sector in which precipitation could not be detected. This ghost echo was found to be produced by reflection from the object causing the blocking to a ground target in the opposite direction. Plate 68d shows the geometry of the situation. The line labeled "orientation of reflector" was found by folding a large tracing of the ground target and ghost echo. When folded along this line, there was near perfect correspondence between the two.
More complex reflection occurrences require a rare combination of reflector/target radar geometry and reflectivities. Analysis indicates that they occur occasionally. However, unless accurate data are recorded at the time of the event, ray tracing techniques will be almost impossible to use in order to reconstruct the possible circumstances. In addition to phantoms, caused by reflecting objects, other types of spurious target returns can be occurring at the same time, further increasing the difficulty of analyzing the unusual sighting. Such things as extraordinary meteorological conditions, and multiple-time-around echoes can also be contributing effects, making the analysis that much more difficult. When interference problems, operator interpretation, and equipment reliability factors are included, one begins to realize that the explanation of reported unusual observations requires extensive research for each incident, and such research is not possible unless all pertinent information has been documented in detail.
- Allen, R.J. and M.G.H. Ligda. "Services for Bird Counter Study and Design," Final Report, Contract DA 42-00 7 AMC-306 (Y), Stanford Research Institute, Menlo Park, (1966).
- Atlas, D. "Radar Lightning Echoes and Atmospherics in Vertical Cross Section," Recent Advances in Atmospheric Electricity, Pergamon Press, New York, (1958a), 441-459.
- Atlas, D. "Radar as a Lightning Detector," Proc. Seventh Wx. Radar Conf., Miami Beach, Fla. (Available from American Meteorological Society, Boston, Mass.), (1958b), C-l - C-8.
- Atlas, D. "Sub-Horizon Radar Echoes by Scatter Propagation," J. Geophysical Res., Vol. 64, (1959), 1205-1218.
- Atlas, D. "Advances in Radar Meteorology," Advances in Geophysics, Vol. 10, Academic Press, New York, (1964), 317-478.
- Atlas, D. "Further Remarks on Atmospheric Probing by Ultrasensitive Radar," Paper presented to the Panel on Remote Atmospheric Probing of the National Academy of Sciences, Chicago, Ill., (1968).
- Atlas, D. and K.R. Hardy. "Radar Analysis of the Clear Atmosphere: Angels," Paper presented to the XV General Assembly of the International Scientific Radio Union, Munich, (1966a).
- Atlas, D., K.R. Hardy, and K. Naito. "Optimizing the Radar Detection of Clear Air Turbulence," J. Appl. Meteor., Vol. 5, (1966b), 450-460.
- Battan, L.J. "Duration of Connective Radar Cloud Units," Bull.AP4S, Vol. 34, (1953), 224-228.
- Bauer, J.R. "The Suggested Role of Stratified Elevated Layers in Transhorizon Short Wave Radio Propagation," Tech.Rep., No. 124, Lincoln Lab. M.I.T., (1956).
- Bean, B.R. and E.J. Dutton. "Radio Meteorology," NBS Monograph 92, U.S. Government Printing Office, Washington, D.C. (1966).
- Blackmer, R.H., Jr. "The Lifetime of Small Precipitation Echoes," Proc. Fifth Wx. Radar Conf. Asbury Park, N.J., (1955), 103-108.
- Blackmer, R.H., Jr. "Anomalous Echoes Observed By Shipborne Radars," Proc. Eighth Wx. Radar Conf., San Francisco, Calif. (available from AMS, Boston, Mass.), (1960), 33-38.
- Blackmer, R.H. Jr. and S.M. Serebreny. "Analysis of Maritime Precipitation Using Radar Data and Satellite Cloud Photographs," J. Appl. Meteor., Vol. 7, (1968), 122-131.
- Bonham, L.L. and L.V. Blake. "Radar Echoes from Birds and Insects," The Scientific Monthly, (April, 1956), 204-209.
- Borden, R.C. and T.K. Vickers. "A Preliminary Study of Unidentified Targets Observed on Air Traffic Control Radars," Technical Development Report No. 180, Civil Aeronautics Adminstration Technical Development and Evaluation Center, Indianapolis, C1953)
- Browning, D.A. and D. Ktlas. "Velocity Characteristics of Some Clear-Air Dot Angels," J. Atmos. Sci., Vol. 23, (1966), 592-604.
- Eastwood, F. Radar Ornithology, Methuen and Co., Ltd., 11 New Fetter Lane, London, 1967.
- Eastwood E., G.A. Isted and G.C. Rider. "Radar Ring Angels and the Roosting Behaviour of Starlings," Proc. Royal Soc., London, Vol. 156, (1962), 242-267.
- Eastwood, E. and G.C. Rider. "Some Radar Measurements of the Altitude of Bird Flight," British Birds, Vol. 58, (1965), 393-420.
- Edrington, T.S. "The Amplitude Statistics of Aircraft Radar Echoes," Trans. IEEE, Vol. MIL 9, (1965), 10-16.
- Ferrari, V.J. "An Epidemiologic Study of USAF Bird Strike Damage and Injury, 1960 to 1965," Life Sciences Division, Norton Air Force Base, California, (1966).
- Geotis, S.G. "Some Radar Measurements of Hailstones," J. Appl. Meteor., Vol. 2, (1963), 270-275.
- Glick, P.A., "The Distribution of Insects, Spiders and Mites in the Air," Tech. Bull. No. 673, U.S. Dept. of Agriculture, (1939)
- Goldstein, H., D.E. Kerr, and A.E. Bent. "Meteorological Echoes," M.I.T. Rad. Lab. Series, McGraw Hill, New York, Vol. 13, (1951), 588-640.
- Glover, K.M., K.R. Hardy, C.R. Landry, and T. Konrad. "Radar Characteristics of Known Insects in Free Flight," Proc., Twelfth Wx. Radar Conf., Norman, Oklahoma, (1966), 254-258.
- Gunn, K.L.S. "Tube Face Filters for Line Space Compensation," Proc. Tenth Wx. Radar Conf., Washington, D.C. (available from AMS, Boston, Mass.), (1963), 361-364.
- Gunn, K.L.S. "Tube Space Filters for Line Space Compensations," Proc. Tenth Wx. Radar Conf., Wash., D.C., (1965).
- Gunn, K. L.S., and T.W.R. East. "The Microwave Properties of Precipitation Particles," Q.J. Roy. Meteor.Soc., Vol. 80, (1954), 552-545.
- Hajovsky, R.G., A.P. Deam, and A.H. La Grone. "Radar Reflections from Insects in the Lower Atmosphere," IEEE Trans., Vol. AP-14, (1966), 224-227.
- Hansford, R.F. (Editor) Radio Aids to Civil Navigation, Heywood and Co. Ltd., London, 1960.
- Hardy, K.R., D. Atlas, and K.M. Glover. "Multiwavelength Backscatter From the Clear Atmosphere," J. Geophys. Res., 71, No. 6, (1966), 1537-1552.
- Hardy, K.R. and I. Katz. "Probing the Atmosphere with High Power, High Resolution Radars," Paper presented to the Panel on Remote Atmospheric Probing of the National Academy of Sciences, Chicago, Ill., (1968a).
- Haworth, L.J. "Introduction to Cathode Ray Tube Displays," M.I.T. Rad. Lab. Series, Vol. 22, Edited by T. Soller, M.A. Starr, and G.E. Valley, Jr., McGraw Hill, New York, (1948).
- Hilst, G.R., and G.P. MacDowell. "Radar Measurements of the Initial Growth of Thunderstorms," Bull. AMS, 31, (1950), 95-99.
- Hiser, H.W. "Some Interesting Radar Observations at the University of Miami," Proc. Fifth Wx. Radar Conf., Asbury Park, N.J., (1955), 287-293.
- Houghton, F. "Detection, Recognition and Identification of Birds on Radar," Proc. Eleventh Wx. Radar Conf., (1964), 14-21.
- Konrad, T.G., J.J. Hicks, and E.B. Dobson. "Radar Characteristics of Birds in Flight," Science, Vol. 159, (1968), 274-280.
- Lack, D. and G.C. Varley. "Detection of Birds by Radar," Nature, Vol. 156, (1945)
- La Grone, A., A. Deam, and G. Walker. Radio Sci. J. Res. (1964, 1965), 68D, 895.
- Lane, J. A. "Small Scale Irregularities of the Radio Refractive Index of the Troposphere," Nature, Vol. 204, (1964), 43 8-440.
- Levine, D. Radargrammetry, McGraw Hill, N.Y. 1960.
- Ligda, M.G.H. "Radar Storm Observation," Compendium of Meteorology, AMS, Boston, Waverly Press, Baltimore, Md., 1951, 1265-1262.
- Ligda, M.G.H. "The Radar Observation of Lightning," J. Atmos. and Terrestrial Physics, Vol. 9, (1956), 329-346.
- Ligda, M.G.H. "Middle-Latitude Precipitation Patterns as Observed by Radar" (a collection of composite radar observations), Scientific Report No. 1, Contract AF 19(604)-1564, Texas A&M College, College Station, Tex., (1957).
- Ligda, M.G.H. "Radar Observations of Blackbird Flights," Texas J. of Science, Vol. 10, (1958), 225-265.
- Ligda M.G.H., and S.G. Bigler. "Radar Echoes From a Cloudless Cold Front," J. Meteor., Vol. 15, (1958), 494-501.
- Ligda, M.G.H., R.T.H. Collis, and R.H. Blackmer, Jr. "A Radar Study of Maritime Precipitation Echoes," Final Report, Contract NOas 59-6170-a, SRI Project 2829, Stanford Research Institute, Menlo Park, Calif., (1960).
- Myres, M.T. "Technical Details of Radar Equipment Detecting Birds, and a Bibliography of Papers Reporting the Observation of Birds with Radar," Field Note No. 9, The Associate Committee on Bird Hazards to Aircraft, National Research Council of Canada, Ottawa, (1964).
- Nagle, R.E. and R.H. Blackmer, Jr. "The Use of Synoptic-Scale Weather Radar Observations in the Interpretation of Satellite Cloud Observations," Final Report, Contract AF 19 (628) -284, SRI Project 3947, Stanford Research Institute, Menlo Park, Calif., (1963).
- Page, R.M. "Radar Goes to Sea," (Unpublished report of early tests of the XAF radar by the U.S. Naval Research Laboratory. Described by Bonham and Blake 1956, (1939).
- Pererson, A.M, R.L. Leadabrand, W.E. Jaye, R.B. Dyce, L.T. Dolphin, R.I. Presnell, L.H. Rorden, and J.C. Schobom. "Radar Echoes Obtained from Earth Satellites, 1957, Alpha and 1957, Beta," Avionics Research, Pergamon Press, N.Y., (1960), 140-145.
- Plank, V.G. "A Meteorological Study of Radar Angels," Geophysical Research Papers No. 52, Air Force Cambridge Res. Lab., Bedford, Mass., (1956).
- Plank, V.G., R.M. Cunningham, and G.F. Campen, Jr. "The Refractive Index Structure of a Cumulus Boundary and Implications Concerning Radio Wave Reflection," Proc. Sixth Wx. Radar Conf. Cambridge, Mass., (1957), 273-280.
- Rainey, R.C. "Radar Observations of Locust Swarms," Science, Vol. 157, No. 3784, (1967) 98-99.
- Ritchie, D.J. Ball Lightning, Consultants Bureau, New York, 1961, 70.
- Rockney, V.D. "The WSR-57 Radar," Proc. Seventh Wx. Radar Conf., Miami Beach, Florida, (1958), F-14 to F-20.
- Schelling, J.G., C.R. Burrows, and E.B. Ferrell. "Ultra-short Wave Propagation," Proc. IRE, Vol. 21, (1933), 427-463.
- Senn, H.V. and H.W. Hiser. "Major Radar Parameters for Airborne Weather Reconnaissance," Proc. Tenth Wx. Radar Conf., Washington, D.C. (available from the AMS, Boston, Mass.), (1963), 341-347.
- Skolnik, M.I. Introduction to Radar Systems, McGraw Hill, New York, 1962, 648.
- Smith, E.K. Jr. and S. Weintraub. "The Constants in the Equation for Atmospheric Refractive Index at Radio Frequencies," Proc IRE, Vol. 41, (1953), 1035-1037.
- Smith, R.L. "Vertical Echo Protrusions Observed by WSR-57 Radar," Progress Report No. 10 on WSR-57 Radar Progrom, Dept. of Commerce, Weather Bureau, Washington, D.C., (1962), 20-30.
- U.S. Aix Force. "Ground Radar Equipment Characteristics Digest," ADCM 50-12, Air Defense Command, Colorado Springs, Cob., (1954)
- U.S. Navy. "Meteorological Aspects of Radio Radar Propagation," NAVWEPS 50-IP-550, U.S. Navy Weather Research Facility, Norfolk, Virginia, (1960).
- Walker, W. "Use of Sun to Check WSR-57 Azimuth and Height Accuracy," Progress Report No. 10 on WSR-57 Radar Program, U.S. Dept. of Commerce, Washington, (1962), 15-19.
- Williams, E.L. "Progress Report on the AN/CPS-9 Radar Program," Proc.Third Wx.Radar Conf. McGill University, Montreal, (1952).