Il est possible que la première observation d'un écho radar venu d'un oiseau ait été faite par R. M. Page Page, R. M.: "Radar Goes to Sea," (Unpublished report of early tests of the XAF radar by the U.S. Naval ResearchLaboratory. Described by Bonham and Blake 1956, (1939) du Laboratoire de Recherche Navale en . Elle fut faite avec un radar expérimental de 200 MHz (le XAF) sur le USS New York près de Puerto Rico. Les échos d'oiseaux, tels que rapportés par Lack et Varley Lack, D. and G.C. Varley. "Detection of Birds by Radar," Nature, Vol. 156, (1945) , furent obtenus sur un dispositif radar de garde-côtes de 10 cm près de Dover au cours de . Des vérifications visuelles confirmèrent ces 2 premières détections par radar comme étant les retours d'oiseaux individuels. De nombreuses observations d'oiseaux par radar ont été faites depuis, en particulier de migrations d'oiseaux comme cela est mis en évidence dans une bibliographie compilée par Myres Myres, M.T. "Technical Details of Radar Equipment Detecting Birds, and a Bibliography of Papers Reporting the Observation of Birds with Radar," Field Note No. 9, The Associate Committee on Bird Hazards to Aircraft, National Research Council of Canada, Ottawa, (1964). listant 89 articles, et un texte écrit par Eastwood Eastwood, F. Radar Ornithology, Methuen and Co., Ltd., 11 New Fetter Lane, London, 1967.. Les sections de coupe radar (sigma) ont été mesurées sur des oiseaux en position fixe suspendus dans une bride non-réfléchissante et d'oiseaux en vol. Les valeurs obtenues, montrées dans les tableaux 2 et 3, varient avec les espèces, aspect et longueur d'onde radar.
En raison de la variation de la puissance 4ème inverse avec la distance, un oiseau à faible distance dans le faisceau principal peut donner un écho radar comparable en intensité à celui d'un appareil dans le faisceau principal à longue distance. Par exemple, si un pigeon avec une section de coupe radar broadside de 100 cm2 volant au sein du faisceau radar à une distance de 10 miles, il produirait un signal aussi fort qu'un avion à réaction avec une valeur de 106 cm2 (100 m2) volant au sein du faisceau radar principal à une distance de 100 miles. Cependant, si l'appareil volait dans un lobe de côté de 40 dB moins puissant que le faisceau principal dans lequel l'oiseau vole les 2 produiraient des signaux d'intensité égale à même distance. Si le lobe de côté était 30 dB de moins, un oiseau dans le faisceau principal à 10 miles aurait l'air d'un appareil à 17,8 miles, et si le lobe de côté était de 20 dB de moins, l'oiseau à 10 miless aurait l'air d'un appareil à 31.6 miles.
Théoriquement la distance maximale de détection telle que dictée par la quantité de signal radar retournée par des oiseaux peut être calculée. Cependant, la vérification n'est pas aisée à cause de la difficulté de repérer un oiseau et établir qu'il correspond à un blip particulier sur un écran radar. Ceci est particulièrement difficile en présence de sea clutter comme cela a été expérimenté lors d'une expérience menée par Allen et Ligda Allen, R.J. and M.G.H. Ligda. "Services for Bird Counter Study and Design," Final Report, Contract DA 42-00 7 AMC-306 (Y), SRI, Menlo Park, (1966). au SRI. Lors d'une expérience menée par Konrad Konrad, T.G., J.J. Hicks, and E.B. Dobson. "Radar Characteristics of Birds in Flight," Science, Vol. 159, (1968), 274-280., des oiseaux individuels furent lâchés depuis un appareil volant au-dessus de l'eau à 5500 pieds-6000 pieds à 8-10 miles marins des radars. Après séparation de l'appareil et des oiseaux sur l'écran radar, chaque oiseau individuel fut automatiquement suivi sur des périodes allant jusqu'à , de sorte que la cible observée fut catégoriquement identifiée comme étant un oiseau. Des floppées d'oiseaux ont été détectées à des distances d'au moins 51 miles marins comme cela est rapporté par Eastwood et Rider Eastwood, E. and G.C. Rider. "Some Radar Measurements of the Altitude of Bird Flight," British Birds, Vol. 58, (1965), 393-420..
| Oiseau | Bande radar | Points at point/sec | Section de coupe radar moyenne (cm2) | Section de coupe radar médiane (cm2) | Root-mean-square fluctuations in Cross-section (cm2) | Mean-to-Median Ratio, p |
|---|---|---|---|---|---|---|
| Quiscale | X | 230 | 16 | 6,5 | 24 | 2,4 |
| S | 230 | 27 | 13 | 31 | 2,2 | |
| UHF-VV* | 230 | 0.73 | 0,58 | 0,6 | 1,3 | |
| UHF-VH† | 230 | 0.37 | 0,15 | 0,7 | ||
| Quiscale | X | 116 | 15 | 7,2 | 21 | 2,1 |
| S | 116 | 23 | 11 | 32 | 2,2 | |
| UHF-VV* | 116 | 0.41 | 0,32 | 0,5 | 1,3 | |
| UHF-VH† | 116 | 0.03 | 0,015 | 0,04 | ||
| Moineau | X | 129 | 1.9 | 1,0 | 2 | 1,9 |
| S | 129 | 15 | 11 | 11 | 1,4 | |
| UHF-VV* | 129 | 0.025 | 0,015 | 0,02 | 1,3 | |
| UHF-VH† | 129 | |||||
| Moineau | X | 233 | 1,3 | 0,60 | 2 | 2,2 |
| S | 233 | 12 | 11 | 5 | 1,1 | |
| UHF-VV* | 233 | 0.020 | 0,02 | 0,01 | 1,1 | |
| UHF-VH† | 233 | |||||
| Pigeon | X | 160 | 15 | 6,4 | 28 | 2,3 |
| S | 160 | 80 | 32 | 140 | 2,5 | |
| UHF-VV* | 160 | 11 | 8,0 | 7,0 | 1,3 | |
| UHF-VH† | 160 | 1,2 | 0,7 | 1,4 |
*VV, Transmit vertical polarization and receive vertical polarization.
†VH, Transmit vertical polarization and receive cross-polarized or horizontal component.
| Bande radar | Aspect* | Sigma de section de coupe (cm2) | |
|---|---|---|---|
| Etourneau sansonnet (Sturnus vulgaris) | X | Tête | 1,8 |
| X | Broadside | 25,0 | |
| X | Queue | 1,3 | |
| Pigeon biset (Columba livia) | X | Tête | 1,1 |
| X | Broadside | 100 | |
| X | Queue | 1,0 | |
| Moineau domestique (Passer domesticus) | X | Tête | 0,25 |
| X | Broadside | 7,0 | |
| X | Queue | 0,18 | |
| Corbeau freux (Corvus frugilegus) | X | Broadside | 250 |
| Buzzard de Turquie | X | Inconnu | 25 à 250 |
| Canard et poulet | UHF† | Tête | 600 |
| UHF† | Queue | 24 |
*For the cross-section measurements of the starling, pigeon, sparrow, and rook, the birds were suspended from a tower with their wings folded; the radar elevation angle was 18°. Measurements of the turkey buzzard were made when the bird was in flight; measurements of the duck and chicken were made when the birds were standing or squatting.
†400 megacycles.
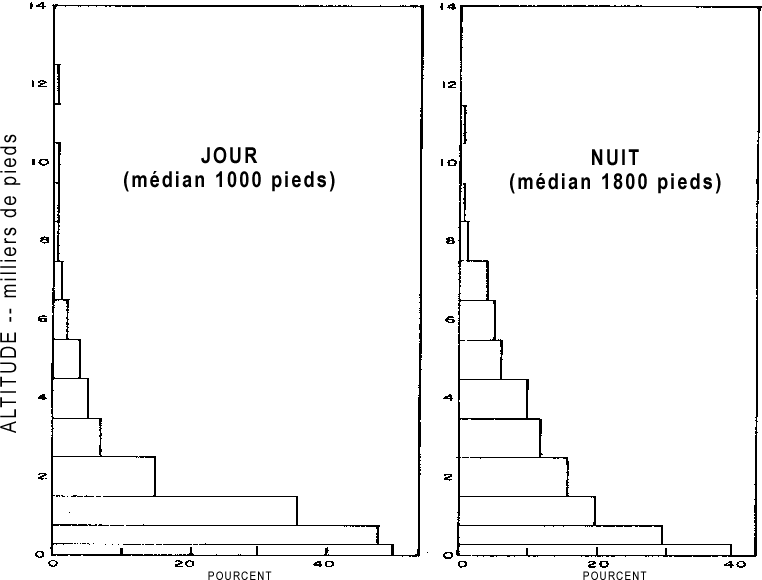
Très peu d'oiseaux volent au-dessus de 13000 pieds ; la plupart volent en-dessous de 5000 pieds. Dans une étude menée par Farrari (1966) des rapports de l'USAF de collisions oiseau-appareils durant , 27 % de l'ensemble des collisions avaient lieu à moins de 100 pieds. 28 % entre 100 pieds et 2000 pieds, 21 % entre 2000 pieds et 3000 pieds, et les 24 % au-dessus de 3000 pieds. Si l'on peut supposer que la probabilité d'une collision oiseau-appareil est tout aussi probable à toutes les altitudes (ce qui pourrait ne pas être complètement valide en raison de l'ascension et de la descente) this should be somewhat of a representative figure of the height of flight for birds. There was one reported bird-aircraft strike at 17000 pieds and a few sightings above 20000 pieds, however the number of birds flying at these altitudes appears to be extremely small.
Eastwood et Rider Eastwood, E. and G.C. Rider. "Some Radar Measurements of the Altitude of Bird Flight," British Birds, Vol. 58, (1965), 393-420. ont rapporté une analyse assez complete de l'altitude de vol de divers oiseaux observés au radar au Laboratoire de Recherche Marconi en Angleterre. Leurs conclusions se sont accordées de très près avec ce qui précède ; près de 90 % de l'ensemble des oiseaux étaient sous les 5000 pieds. Les oiseaux volent plus haut de nuit et pendant les périodes de migration de printemps et d'automne. Un tracé de la distribution moyenne d'altitude au cours de l'année est montré en figure 4. L'ensemble de ces chiffres est probablement applicable en tant qu'altitude au-dessus du terrain général ; i.e., à 5000 pieds au-dessus du niveau moyen de la mer, 90 % des oiseaux voleraient à des altitudes inférieures à 10000 pieds m.s.l. La quantité de couverture nuageuse affecte également la hauteur à laquelle volent les oiseaux. Des diagrammes inclus par Eastwood et Rider Eastwood, E. and G.C. Rider. "Some Radar Measurements of the Altitude of Bird Flight," British Birds, Vol. 58, (1965), 393-420. indiquent clairement a marked tendency for higher mean altitudes to be flown in the presence of complete cloud cover.
Target airspeed is another means for identifying a bird. It can be obtained vectorially from a knowledge of the wind velocity and the radar-measured target velocity. Houghton Houghton, F. "Detection, Recognition and Identification of Birds on Radar," Proc. Eleventh Wx. Radar Conf., (1964), 14-21. determined the airspeed of a limited sampling of the birds by visually identifying each through a telescope aimed by tracking radar Fig. 5. In all cases the wind speeds were less than 5 knots. Target air speed cannot invariably distinguish between a helicopter, a slow moving aircraft and a bird flying in a high wind without precise knowledge of the wind at the bird altitude.
Flocks of birds sometimes produce rings on a radar scope which expand from a number of fixed points. These have been called "ring angels" and were first attributed to birds by Ligda Ligda, M.G.H. "Radar Observations of Blackbird Flights," Texas J. of Science, Vol. 10, (1958), 225-265. . Visual confirming observations were lacking at that time. Later, Eastwood, Isted and Rider Eastwood E., G.A. Isted and G.C. Rider. "Radar Ring Angels and the Roosting Behaviour of Starlings," Proc. Royal Soc., London, Vol. 156, (1962), 242-267. verified that radar ring angels were definitely caused by the dispersal of starlings (Sturnus vulgaris) from their roosts at sunrise. After several radar scope observations were studied, it became possible to pinpoint the centers of the rings and the approximate locations of the roosts. A number of observers equipped with radio telephones were stationed at each location and signaled the precise moment of emergence of the successive flocks of starlings from the roost under observations. These data were correlated with the radar scope presentations to confirm definitely the generation of ring angels by birds. The mean air speed of starlings leaving the roost was measured as 37 knots.
Under some conditions, slow-moving ring echoes may be produced by the rise of a temperature inversion layer in the early morning hours after sunrise. Sea-breeze fronts have occasionally been seen on radar as a line, and at other times as a boundary between scattered and concentrated signal returns as shown by Eastwood Eastwood, F. Radar Ornithology, Methuen and Co., Ltd., 11 New Fetter Lane, London, 1967.. How much of the line produced is due to the meteorological effects and how much by birds and insects is still a matter for speculation. However, Eastwood Eastwood, F. Radar Ornithology, Methuen and Co., Ltd., 11 New Fetter Lane, London, 1967. cites reports by glider pilots sharing upcurrents with birds taking advantages of the lift provided. This and some limited study of the characteristics of the radar scope signals, produce some indication as to the validity of the bird theory.
Some studies have been made on target signal fluctuation and other signature analysis techniques in connection with birds Eastwood, F. Radar Ornithology, Methuen and Co., Ltd., 11 New Fetter Lane, London, 1967. and even with insects Glover, K.M., K.R. Hardy, C.R. Landry, and T. Konrad. "Radar Characteristics of Known Insects in Free Flight," Proc., Twelfth Wx. Radar Conf., Norman, Oklahoma, (1966), 254-258. . Some of the signal characteristics have been attributed to aspect of the target and others to wing motion. There is ample evidence that insects are to be found in the atmosphere well above the surface. Apart from flying insects, creatures such as spiders can become airborne on strands of gossamer and be borne aloft in convective air currents. Glick Glick, P.A., "The Distribution of Insects, Spiders and Mites in the Air," Tech. Bull. No. 673, U.S. Dept. of Agriculture, (1939) reports in considerable detail the results of collecting insects from aircraft over the southern U.S. and Mexico. He found concentrations of insects of the order 1 per 2 cubic kilometers in the layer between 1000 pieds et 4000 pieds above the ground, with more widely spaced encounters up to four or five times the latter height. Although more recent data do not appear to have been collected, it is common for sailplane pilots to experience many types of insects impinging on the canopy or the leading edges of the wings at altitudes exceeding 10000 pieds au-dessus du terrain. Less commonly, birds feeding on insects carried aloft by thermals are observed at similar altitudes.
The radar cross-sections (sigma) of the various insects listed in Table 4 (measured at wavelenths of 3.2 cm.) range from 0.01 cm2 to 1.22 cm2 for all but the locust which has a maximum sigma value of 9.6 cm2. The ability of any given radar system to detect radar cross sections of these low values is a function of its design, its current performance, and the ability of the operator. Ultra-sensitive radar systems such as the MIT Lincoln Laboratory radars at Wallops Island, Va. have reported minimum detectable cross-sections at 10 km. of 6x10⁻⁴ cm2 for the X-band, 2.5x10⁻⁵ cm2 for the S-band, and 3.4x10⁻⁵ cm2 for the UHF radars (Hardy, 1966). The X-band radar is 2 orders more sensitive than required to detect the listed insects at a range of 10 km. and probably is functioning close to the limit of detectability. The majority of other radar systems in general use today are less sensitive. Some are not able to detect insects in the lower range of a values. Tabulation of a large number of radar system characteristics has been published in classified documents by RAND. Major radar parameters for some airborne sets are listed in an article by Senn and Hiser Senn, H.V. and H.W. Hiser. "Major Radar Parameters for Airborne Weather Reconnaissance," Proc. Tenth Wx. Radar Conf., Washington, D.C. (available from the AMS, Boston, Mass.), (1963), 341-347..
Insects are commonly found at surprisingly high altitudes. Swarms of butterflies and other insects are found in summer on 14000 pieds. mountain peaks in the Rockies. A few insects have been reported at over 25 000 pieds. altitudes in the Himalayas.
Verification of insects as causing a particular blip on a radar scope is even more difficult than birds. Flowever, this was accomplished as reported by Glover, et al Hardy, K.R., D. Atlas, and K.M. Glover. "Multiwavelength Backscatter From the Clear Atmosphere," J. Geophys. Res., 71, No. 6, (1966), 1537-1552.. Single insects were released from an aircraft and tracked by radar at altitudes from 1,6 à 3,0 km et à des ranges jusqu'à 18 km. Experiments of this sort and other studies involving clear atmosphere probing with high-power radars (Atlas, 1966; Hardy, 1966 and 1968) have led to valid conclusions that most of the dot echoes are caused by insects or birds.
| Insecte | Longueur du corps (mm) | Diamètre du corps (mm) | sigma L (cm2) | sigma tau (cm2) | |
|---|---|---|---|---|---|
| Diptère | Mouche Range Crane, Timpula Simplex | 13 | 1 | 0,30 | 0.02 |
| Mouche verte, Lucilia Ceasar | 9 | 3 | 0,25 | 0.10 | |
| Hyménoptère | Abeille domestique, Apis Mellifera | 13 | 6 | 1,00 | 0.30 |
| California Harvester Ant, Pogonomyrmex Californicus | 13 | 6 | 0,04 | 0.02 | |
| Coléoptère | Convergent Lady Beetle, Hippodamia Convergens | 5 | 3 | 0,02 | 0.01 |
| Twelve-spotted Cucumber Beetle, Diabratica Duodecimpunctata | 8 | 4 | 0,14 | 0.05 | |
| Lépidoptère | Noctuelle des graminées, Cirphis Unipuncta | 14 | 4 | 1,22 | 0.12 |
| Alfalfa Caterpillar Butterfly, Colias Eurytheme | 14 | 1,5 | 0,65 | 0.02 | |
| Orthoptère | Blue Winged Locust, Trimeratropic Dyanipennis | 20 | 4 | 9,60 | 0.96 |
| Aranedia | Araignée (non identifiée) | 5 | 3,5 | 0,10 | 0.06 |
Attention has been given by Browning (1966) to the determination of the velocity characteristics of some clear-air dot angels. A 5.42 cm. pulse Doppler radar with a 1° beam elevated at 30° and rotating at 4 rpm was used in the study. A series of radar soundings spaced about half to one hour apart were obtained at 500 ft. altitude intervals up to 3000 ft. using range-gating techniques. Temperature, humidity and wind data were collected simultaneously with the radar soundings.
Three kinds of angel population were distinguished according to their mean deviation from the swarm velocity, their average vertical motion, their maximum relative velocities and their sigma values. Atmospheric inhomogeneities or the presence of plant seeds appeared to be ruled out because of the small back-scattering cross-sections of individual angels (less than approximately 0.1 cm2), their discreteness in space and velocity, their often quite large mean deviations (up to 4 m sec-1) from a uniform velocity, and the fact that the only major upward velocities occurred after sunset, at a time when the lapse rate was becoming increasingly stable. The same data suggest insects as the likeliest cause.
- Atlas, D. "Radar Lightning Echoes and Atmospherics in Vertical Cross Section," Recent Advances in Atmospheric Electricity, Pergamon Press, New York, (1958a), 441-459.
- Atlas, D. "Radar as a Lightning Detector," Proc. Seventh Wx. Radar Conf., Miami Beach, Fla. (Available from American Meteorological Society, Boston, Mass.), (1958b), C-l - C-8.
- Atlas, D. "Sub-Horizon Radar Echoes by Scatter Propagation," J. Geophysical Res., Vol. 64, (1959), 1205-1218.
- Atlas, D. "Advances in Radar Meteorology," Advances in Geophysics, Vol. 10, Academic Press, New York, (1964), 317-478.
- Atlas, D. "Further Remarks on Atmospheric Probing by Ultrasensitive Radar," Paper presented to the Panel on Remote Atmospheric Probing of the National Academy of Sciences, Chicago, Ill., (1968).
- Atlas, D. and K.R. Hardy. "Radar Analysis of the Clear Atmosphere: Angels," Paper presented to the XV General Assembly of the International Scientific Radio Union, Munich, (1966a).
- Atlas, D., K.R. Hardy, and K. Naito. "Optimizing the Radar Detection of Clear Air Turbulence," J. Appl. Meteor., Vol. 5, (1966b), 450-460.
- Battan, L.J. "Duration of Connective Radar Cloud Units," Bull.AP4S, Vol. 34, (1953), 224-228.
- Bauer, J.R. "The Suggested Role of Stratified Elevated Layers in Transhorizon Short Wave Radio Propagation," Tech.Rep., No. 124, Lincoln Lab. M.I.T., (1956).
- Bean, B.R. and E.J. Dutton. "Radio Meteorology," NBS Monograph 92, U.S. Government Printing Office, Washington, D.C. (1966).
- Blackmer, R.H., Jr. "The Lifetime of Small Precipitation Echoes," Proc. Fifth Wx. Radar Conf. Asbury Park, N.J., (1955), 103-108.
- Blackmer, R.H., Jr. "Anomalous Echoes Observed By Shipborne Radars," Proc. Eighth Wx. Radar Conf., San Francisco, Calif. (available from AMS, Boston, Mass.), (1960), 33-38.
- Blackmer, R.H. Jr. and S.M. Serebreny. "Analysis of Maritime Precipitation Using Radar Data and Satellite Cloud Photographs," J. Appl. Meteor., Vol. 7, (1968), 122-131.
- Bonham, L.L. and L.V. Blake. "Radar Echoes from Birds and Insects," The Scientific Monthly, (April, 1956), 204-209.
- Borden, R.C. and T.K. Vickers. "A Preliminary Study of Unidentified Targets Observed on Air Traffic Control Radars," Technical Development Report No. 180, Civil Aeronautics Adminstration Technical Development and Evaluation Center, Indianapolis, C1953)
- Browning, D.A. and D. Ktlas. "Velocity Characteristics of Some Clear-Air Dot Angels," J. Atmos. Sci., Vol. 23, (1966), 592-604.
- Edrington, T.S. "The Amplitude Statistics of Aircraft Radar Echoes," Trans. IEEE, Vol. MIL 9, (1965), 10-16.
- Ferrari, V.J. "An Epidemiologic Study of USAF Bird Strike Damage and Injury, 1960 to 1965," Life Sciences Division, Norton Air Force Base, California, (1966).
- Geotis, S.G. "Some Radar Measurements of Hailstones," J. Appl. Meteor., Vol. 2, (1963), 270-275.
- Goldstein, H., D.E. Kerr, and A.E. Bent. "Meteorological Echoes," M.I.T. Rad. Lab. Series, McGraw Hill, New York, Vol. 13, (1951), 588-640.
- Gunn, K.L.S. "Tube Face Filters for Line Space Compensation," Proc. Tenth Wx. Radar Conf., Washington, D.C. (available from AMS, Boston, Mass.), (1963), 361-364.
- Gunn, K.L.S. "Tube Space Filters for Line Space Compensations," Proc. Tenth Wx. Radar Conf., Wash., D.C., (1965).
- Gunn, K. L.S., and T.W.R. East. "The Microwave Properties of Precipitation Particles," Q.J. Roy. Meteor.Soc., Vol. 80, (1954), 552-545.
- Hajovsky, R.G., A.P. Deam, and A.H. La Grone. "Radar Reflections from Insects in the Lower Atmosphere," IEEE Trans., Vol. AP-14, (1966), 224-227.
- Hansford, R.F. (Editor) Radio Aids to Civil Navigation, Heywood and Co. Ltd., London, 1960.
- Hardy, K.R. and I. Katz. "Probing the Atmosphere with High Power, High Resolution Radars," Paper presented to the Panel on Remote Atmospheric Probing of the National Academy of Sciences, Chicago, Ill., (1968a).
- Haworth, L.J. "Introduction to Cathode Ray Tube Displays," M.I.T. Rad. Lab. Series, Vol. 22, Edited by T. Soller, M.A. Starr, and G.E. Valley, Jr., McGraw Hill, New York, (1948).
- Hilst, G.R., and G.P. MacDowell. "Radar Measurements of the Initial Growth of Thunderstorms," Bull. AMS, 31, (1950), 95-99.
- Hiser, H.W. "Some Interesting Radar Observations at the University of Miami," Proc. Fifth Wx. Radar Conf., Asbury Park, N.J., (1955), 287-293.
- La Grone, A., A. Deam, and G. Walker. Radio Sci. J. Res. (1964, 1965), 68D, 895.
- Lane, J. A. "Small Scale Irregularities of the Radio Refractive Index of the Troposphere," Nature, Vol. 204, (1964), 43 8-440.
- Levine, D. Radargrammetry, McGraw Hill, N.Y. 1960.
- Ligda, M.G.H. "Radar Storm Observation," Compendium of Meteorology, AMS, Boston, Waverly Press, Baltimore, Md., 1951, 1265-1262.
- Ligda, M.G.H. "The Radar Observation of Lightning," J. Atmos. and Terrestrial Physics, Vol. 9, (1956), 329-346.
- Ligda, M.G.H. "Middle-Latitude Precipitation Patterns as Observed by Radar" (a collection of composite radar observations), Scientific Report No. 1, Contract AF 19(604)-1564, Texas A&M College, College Station, Tex., (1957).
- Ligda M.G.H., and S.G. Bigler. "Radar Echoes From a Cloudless Cold Front," J. Meteor., Vol. 15, (1958), 494-501.
- Ligda, M.G.H., R.T.H. Collis, and R.H. Blackmer, Jr. "A Radar Study of Maritime Precipitation Echoes," Final Report, Contract NOas 59-6170-a, SRI Project 2829, Stanford Research Institute, Menlo Park, Calif., (1960).
- Nagle, R.E. and R.H. Blackmer, Jr. "The Use of Synoptic-Scale Weather Radar Observations in the Interpretation of Satellite Cloud Observations," Final Report, Contract AF 19 (628) -284, SRI Project 3947, Stanford Research Institute, Menlo Park, Calif., (1963).
- .
- Pererson, A.M, R.L. Leadabrand, W.E. Jaye, R.B. Dyce, L.T. Dolphin, R.I. Presnell, L.H. Rorden, and J.C. Schobom. "Radar Echoes Obtained from Earth Satellites, 1957, Alpha and 1957, Beta," Avionics Research, Pergamon Press, N.Y., (1960), 140-145.
- Plank, V.G. "A Meteorological Study of Radar Angels," Geophysical Research Papers No. 52, Air Force Cambridge Res. Lab., Bedford, Mass., (1956).
- Plank, V.G., R.M. Cunningham, and G.F. Campen, Jr. "The Refractive Index Structure of a Cumulus Boundary and Implications Concerning Radio Wave Reflection," Proc. Sixth Wx. Radar Conf. Cambridge, Mass., (1957), 273-280.
- Rainey, R.C. "Radar Observations of Locust Swarms," Science, Vol. 157, No. 3784, (1967) 98-99.
- Ritchie, D.J. Ball Lightning, Consultants Bureau, New York, 1961, 70.
- Rockney, V.D. "The WSR-57 Radar," Proc. Seventh Wx. Radar Conf., Miami Beach, Florida, (1958), F-14 to F-20.
- Schelling, J.G., C.R. Burrows, and E.B. Ferrell. "Ultra-short Wave Propagation," Proc. IRE, Vol. 21, (1933), 427-463.
- Skolnik, M.I. Introduction to Radar Systems, McGraw Hill, New York, 1962, 648.
- Smith, E.K. Jr. and S. Weintraub. "The Constants in the Equation for Atmospheric Refractive Index at Radio Frequencies," Proc IRE, Vol. 41, (1953), 1035-1037.
- Smith, R.L. "Vertical Echo Protrusions Observed by WSR-57 Radar," Progress Report No. 10 on WSR-57 Radar Progrom, Dept. of Commerce, Weather Bureau, Washington, D.C., (1962), 20-30.
- U.S. Aix Force. "Ground Radar Equipment Characteristics Digest," ADCM 50-12, Air Defense Command, Colorado Springs, Cob., (1954)
- U.S. Navy. "Meteorological Aspects of Radio Radar Propagation," NAVWEPS 50-IP-550, U.S. Navy Weather Research Facility, Norfolk, Virginia, (1960).
- Walker, W. "Use of Sun to Check WSR-57 Azimuth and Height Accuracy," Progress Report No. 10 on WSR-57 Radar Program, U.S. Dept. of Commerce, Washington, (1962), 15-19.
- Williams, E.L. "Progress Report on the AN/CPS-9 Radar Program," Proc.Third Wx.Radar Conf. McGill University, Montreal, (1952).