Capt. Bowyer reported that direct sunlight was obscured (the sun at 1410Z was elevation 44° 45' azimuth 225° 20') by a "stratus" sheet a few thousand feet above his altitude extending 10 miles S of Guernsey. There was broken high cloud, some cloud to the E and a solid cloud mass to the W but a clear horizon to the SW ahead of the plane despite a haze at about 2000 ft. Air temperature outside the BN2a Trislander at FL40 was ~10°C.
As recorded in the report to CAA (Appendix A), forecast average winds for the Southampton- Alderney fuel calculation were SW 8 knots n1 UK Met Office forecasts and nearest UK and French balloon ascents all indicate around 20-25 knots at the cruise altitude. Our flightpath reconstruction does not of course depend on a wind calculation because we are using the radar plot.. The Alderney Airport surface weather report at 290 ft (88m) AMSL for 1350Z was: 200° 6 knots, visibility CAVOK, temperature 14°C, dewpoint 11°C, QNH pressure 1021 mbar.
Other sources were consulted to reconstruct the local weather conditions in more breadth and detail. Sources included professional meteorologists, several with expertise in the Channel Islands n2See Acknowledgements, all Guernsey Airport and Alderney Airport half-hourly surface weather reports covering the period 1150 - 1550Z (Appendix C, Table 2), daily climate records for the month of April from Jersey Met Office (Appendix C, Figs. 4-7), upper air radiosonde balloon measurements of pressure, temperature, dewpoint and winds from the four nearest French and English release sites (Appendix C, Tables 4-8 ), satellite images n3Courtesy of Dundee University Satellite Receiving Station., miscellaneous other UK Met Office weather products, and Jersey Met Office C-band weather radar images.
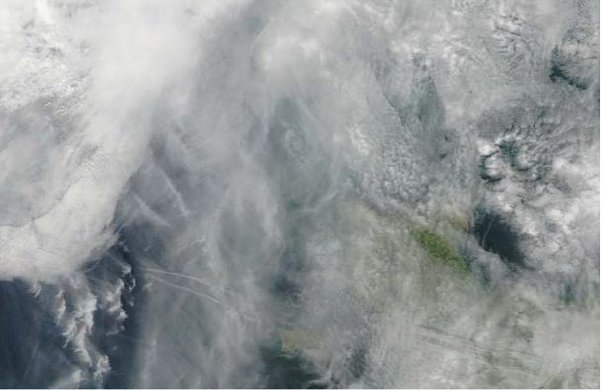
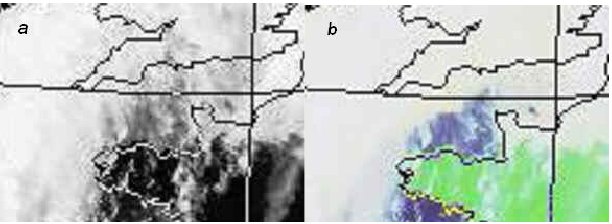
The general picture reported by Capt Bowyer seems consistent with meteorological observations and satellite images. The Guernsey and Alderney half-hourly met obs show 7/8 and 6/8 altocumulus at 12,000 and 10,000ft respectively for the previous few hours, in the process of clearing at about the time of the observations, and 7/8 cirrus at 25,000 ft (Appendix C, Table 2) The UK Met Office pressure chart, 1200Z, 23 April 2007 (Appendix C, Fig.1) shows an upper cold front moving in from the W ahead of a low-level cold front, and a weak warm front retreating to the E. Images from the 1415Z NOAA 18 satellite pass (Fig.8) are of poor resolution but show the general situation of a dense cloud mass associated with the frontal system to the W. An earlier MODIS n4 The Moderate Resolution Imaging Spectroradiometers, carried on NASA's Terra (EOS AM) and Aqua (EOS PM) earth observation satellites, image the earth regularly in many bandwidths. Images in the red and infrared are produced at resolutions down to 250m. image taken at 1328Z with higher resolution to 250m (Fig. 19) shows a chaotic cloud system with divergent winds associated with the approaching cold front. Hooked plumes of high-level cirrus uncinus to the W of Guernsey indicate wind shear at around 25,000 ft possibly associated with the frontal surface. A number of jet contrails are visible at high altitude.
Unfortunately no regular radiosonde balloon ascents are made in or near the Channel Islands. This means that almost no direct temperature, pressure, dewpoint or winds aloft measurements exist for the column of atmosphere over the area of interest. However some conclusions are possible from surface reports and other meteorological data and scheduled balloon ascents from surrounding sites in France and the UK.
The UK Met Office's noon synoptic pressure chart shows isobars to the N and W of the area lying roughly SW-NE, indicating the tendency of the geostrophic wind associated with the low pressure centre to the NW of the British Isles. To the SE of the area most of the continent lies under a rather flat pressure field with few isobars. High pressure is found to the S along the Mediterranean.
The nearest scheduled radiosonde upper air profiles were obtained n5 Courtesy of the Dept of Atmospheric Science, University of Wyoming College of Engineering for Brest in Brittany, Trappes in inland France and Herstmonceux and Camborne in Southern England (the 1200Z ascent readings for these stations along with station information and sounding indices are shown in Appendix C, Tables 4-7), together with the surface wind and temperature chart for mainland France (Appendix C, Fig. 2).
The noon chart of surface winds in France (focusing particularly on north-western France) shows the winds generally rotated to the S of W. The winds aloft were generally force 4 - 7 (a moderate breeze to a moderate gale) while surface winds were generally force 2, a slight breeze.
The Jersey Met Office 1300-1800Z aviation forecast for the Channel Islands area (Appendix C, Fig.3) predicted winds from 230° at 10,000ft, 220° at 5000ft and 210° at 1000ft. The average surface winds actually measured at Guernsey and Alderney between 1150 and 1550Z were 195° and 189° respectively. The speeds of the winds aloft were forecast by Jersey Met as 15-30kts through 2000-18,000ft , and by the UK Met Office Form 214 forecast (for the north of the area, Appendix C, Table 1) as 20-25kts at 1000ft and above. Measured surface wind speeds were only about 6-7kts.
The Brest noon temperature profile is thought to be the most directly relevant to Channel Islands conditions on the day. Brest soundings are reputed to be typically somewhat "bland" n6Frank LeBlanq, Jersey Met Dept, email to Tim Lillington, Guernsey Airport Met Office, & Martin Shough, 27.07.2007, nevertheless there is no inversion on the Brest (or Trappes) profile below about 40,000 ft. Small low-level inversions at Camborne and Herstmonceux in the UK were determined to have causes not directly connected with conditions in the Channel Islands area (see below).
Sea surface temperature (SST) measurements were of interest. These were available for St Helier, Jersey, St. Peter Port, Guernsey, and the Channel Light Vessel. Satellite infrared sea surface temperature maps were also obtained courtesy of the French oceanographic agency IFREMER n7Institut français de recherche pour l'exploitation de la mer. Special thanks to Francis Gohin, Département Dynamiques de l'Environnement Côtier, IFREMER BREST (Unfortunately valid data for April 23 2007 were limited due to cloud and haze.)
An estimate of the vertical air temperature profile(s) in the line of sight was considered especially important. Bearing in mind that the direct physical measurements available are incomplete, the evidence for temperature inversions of various types in the sighting area was considered as follows.
- Surface advection inversion
- Anticyclonic inversion
- Frontal inversion
- Elevated subsidence inversion
- Elevated advection inversion
In summary, we conclude on the basis of meteorological evidence that there is a likelihood of a significant inversion in the first ~200m over the cool sea to the S of the Channel Islands area, strong near the Breton coast where it probably reached an optical ducting gradient, becoming weaker further north. There seems to be neither evidence of, nor a plausible mechanism for, an elevated temperature inversion - at least in the lower atmosphere below the freezing level n8The highest angular elevation of the visual line of sight to the UAPs from ~4200ft AMSL was approximately tangential to the 2000 ft haze-layer horizon. Most of the time the LOS actually intersected the sea. Therefore the haze layer, well below the 10,000ft freezing level, represents the approximate maximum altitude of any relevant optical duct. See Section 6(d), Surface reflections and mirages. (Detailed discussion of the optical effects of temperature, pressure and humidity gradients is in Section 6.)