As mentioned in Section 3 we had obtained useful composite screenshots of the Channel Islands Control Zone ATC radar picture produced by the ELVIRA software from radar files in ASTERIX format (a European standard format for radar data management). We were also provided by Jersey ATC with a complete 24-hour ELVIRA radar playback and original data files in RDIF format for a period of several hours containing the sighting period. However for various reasons n1For commercial licensing reasons it transpired that Jersey ATC were unable to share the software for viewing the complete files. We had mathematical and computing expertise in our team, but the task of writing a viewer to visualise the data was a huge and impracticable one. Costly commercial software required prohibitive machine specifications. Air traffic management experts at the Dutch National Aerospace Laboratory (NLR) in Amsterdam were among many who provided helpful advice and offered to visualise the data for us but only under a commercial contract. However at an early stage we had discussion with GEIPAN who indicated a possible interest owing to the location of the incident. Dr. Clarke met in Italy with GEIPAN's director Jacques Patenet offering an exchange of information and specifically requesting CNES expertise to assist with accessing the radar data files provided by Jersey ATC. When we encountered difficulties finding accessible software we reverted to GEIPAN, but we now learned (via the third party already mentioned) that GEIPAN were unable to offer cooperation, moreover that they had in fact made an independent approach to Jersey ATC for the same data files, and that the ATC specialist working with GEIPAN would be unable to share the radar visualisation software with us. Given GEIPAN's official access to facilities and expertise we concluded that duplication of effort would be a waste of our limited resources. We decided to focus on other aspects of the investigation and await the completion of GEIPAN's detailed study of the radar files. the following discussion is limited to the information contained in composite screenshot format. We discuss later the extent to which this limitation affects present conclusions.
Controlled airspace extends from the surface to 5486 m throughout the Channel Islands Zone. It is managed from the Air Traffic Control centre at Jersey States Airport, where the radar picture is assembled from two radar sources. The SSR (Secondary Surveillance Radar) antenna sited on Jersey provides signals from transponder-equipped air traffic n2The aircraft's onboard radar transponder beacon sends automatic replies to interrogations received from the ground radar. Coded replies identify the aircraft on the radar screen alongside altitudes derived from the aircraft's pressure altimeter, whilst primary echoes from nontransponder traffic and other radar targets are provided by a feed from a separate PSR (Primary Surveillance Radar) antenna sited on the island of Guernsey.
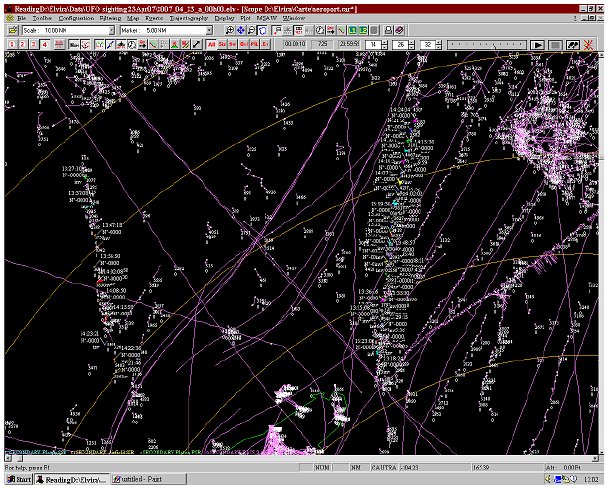
In addition to the SSR plots of transponder-carrying aircraft the ATC radar showed a large number of primary contacts (echoes of radar pulses from reflective objects or surfaces) detected by the Guernsey radar head. Most of these contacts were impossible to positively identify from the plot-extracted synthetic display provided by ELIVIRA (see Fig. 11). It is to be expected that some are due to sea birds, surface ships and other commonplace reflectors, in combination with anomalous propagation as originally suspected by Controller Paul Kelly.
On first contact with Jersey, Capt Bowyer simply asked Kelly if radar showed any traffic directly ahead of him in his 12 o'clock. Kelly replied in the negative. However he did advise that there was a primary target showing at 11 o'clock 4 miles from the aircraft. At 1411:11 Kelly advised Bowyer that there was a primary target now 10 o'clock 3 miles from the aircraft, but suggested it might be an anomalous propagation echo. A few primary contacts are visible close to the flight track around 10-15nmi NNE of ORTAC on the radar map in Fig.7. The Trislander appears to leave these behind. They appear unrelated to the object observed visually.
Not until 1414:23 did Kelly reply to another query from Capt Bowyer to the effect that he now had a primary target -
a single blob
- about 8 miles W of Alderney in the vicinity of the Casquets. Bowyer commented that this could
fit the position of one of the UAPs. This echo was still there at 1415 when Kelly asked the FlyBe 146 to look for a
visual on a primary target, below them about 1 mile on their right, again in the vicinity of the Casquets
. The
FlyBe was unable to see anything.
In his CAA report Paul Kelly described this echo as anaprop possibly associated with one of the objects
. He
confirmed to us later n3 Telephone conversation with Jean-Francois Baure. and independently
to Capt Bowyer that it was unstable or ragged
, and that in his opinion it was probably not a solid target.
However this echo position - about 1 mile on the right of FlyBe at about 1415 - would be close to the 1415 position of
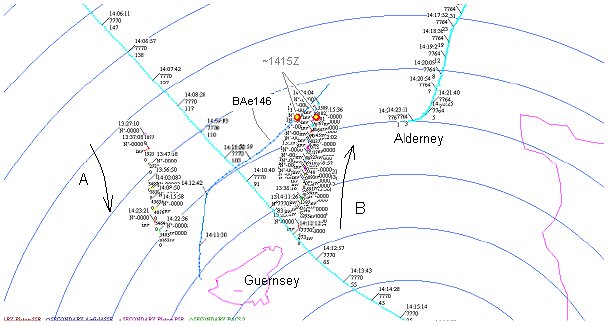
one quite prominent slow target plotted moving north of Guernsey, shown as Track B in Fig 12. Whilst this could
possibly be described as ragged
n4 The variety of screen colours used for successive plots in Fig 11 indicates this. The overall track seen here is not
produced automatically by plot-extraction software; rather, Jersey radar engineers have made a manual selection of
an apparently connected sequence of short track segments. The software has allocated colours at random for each
new segment. An unbroken track would retain the same colour, so we can see that this track has many missing data
points. it appears to be a fairly definite track rather than sporadic anomalous propagation.
It was suspected early on that this and another track (Track A, Fig.12), similar but moving southbound at a few knots, could be surface ships on routes between the Channel Islands and the south coast ports of England. Capt Bowyer noted:
There are a number of spurious primary returns but there are also however two very definite tracks each lasting around an hour and then disappearing, one, the closest travelling north at about 10 kts, the second travelling south at a similar speed five miles further west. They would appear to be in the correct position from my point of view n5 In fact the line of sight to the westernmost track (A) would be several degrees beyond the western limit of the bearing to the UAPs which is delimited by the Casquets Lighthouse. Track B could quite close to the location of UAP #1 as triangulated by the lines of sight (see Section 3).
It is possible that they may be ships as the primary return is very sound and speed conducive with a ship, however, no large vessels travel on the west side of Guernsey and the East side plot does not coincide with any regular service out of Guernsey as far as I can ascertain n6Email from Capt Bowyer to Dave Clarke, 24.06.07.
Timetables of ferry routes between St. Malo, the Channel Islands, and the south coast ports of England were studied and inquiries were made of the St. Malo Harbourmaster n7 Email from Bruno Lassus, Le Commandant de Port, St.Malo port authority, to J-F.Baure, 17.07.2007. A second vessel, the NOLA, departing St Malo for Amsterdam the previous evening, may also have been in the area.. Journey times are subject to change due to weather and tidal variation and it was not possible to locate records of the day's exact sailing times. But evidence suggests that one echo (Track B in Fig.12) could be a northbound Brittany Ferries vessel n8 MV BRETAGNE, see https://www.brittany-ferries.co.uk/index.cfm?articleid=149 scheduled to leave St Malo at 09:45Z and arriving in Portsmouth at 19:30Z, reaching the vicinity of Alderney at approximately 14:30Z. Inquiries to the Guernsey Harbourmaster disclosed n9Letter from AJB Pattimore, Deputy Harbourmaster, Guernsey Harbour Authority, to Paul Fuller, 14 Aug 2007. that all regular sailings would traverse the Little Russel channel on the east side of Guernsey delimited by the Little Russel (or Roustel) Lighthouse located off the northwest point of the island of Herm. If Track B is extrapolated southward it passes approximately through this channel (see Fig.13).
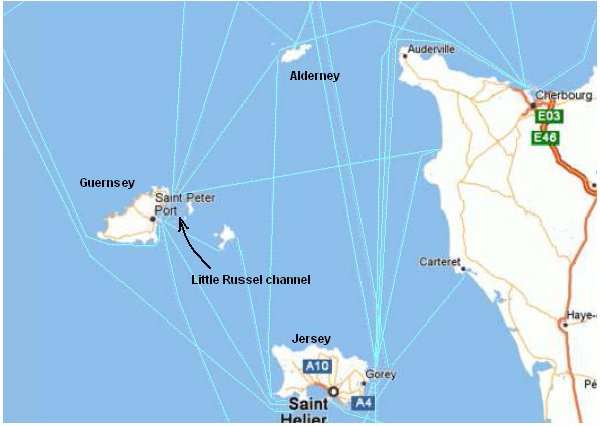
The radar track passing to the W of Guernsey (Track A in Fig.12) is also close to a navigation route heading around
the SW tip of Guernsey (via the Hanois Light and then NNW) and another route from St Helier, Jersey (Fig.13). But the
only vessel of any size in this vicinity on that day, according to the Guernsey Harbourmaster's records, was a vessel
called the Agility which left Guernsey at 11:04 Alpha
(a military time zone equivalent to CET or BST, i.e.
GMT+1 = 10:04Z), or four hours before the start of the sighting. This is not only the wrong time frame for the western
track we see on the radar; the Agility was outward bound for Milford Haven, Wales, whilst the radar track is headed
south n10Note that the projection of this track on the sea surface 30-40nmi away from the Jersey radar antenna would be approaching twice the normal horizon distance from the radar, and it can be shown that even in radio trapping
conditions (more severe than the moderately super-refractive conditions for which there is evidence) it would lie
entirely in the radar-shadow of the Island of Guernsey. These primary contacts are fed in to the radar picture from
the antenna sited on the island of Guernsey ..
So initial inquiries fell short of proving conclusively that either of these targets was a ship, but found a
reasonable probability in at least one case. If the Guernsey Harbourmaster's records are complete then the other
target remains unidentified, although an unrecorded smaller ship is a possibility n11 Trislander passenger Kate Russell observed a little fishing boat
ahead of the plane in the direction of the UAPs
(see Section 3 & Appendix B). Coastal vessels, small cargo ships, ferries and the like would not necessarily be
governed by the mandatory traffic separation rules. There might also be unregistered rogue vessels operating on
designated routes. A Nov 2003 Press Release from the marine insurance group North of England P&I stated: Rule
10 on the conduct of vessels in traffic-separation schemes is one of the most frequently misunderstood sections of the
IMO's 1972 International Regulations for Prevention of Collisions at Sea,' . . . 'Radio logs at, say, Dover in England
or Ushant in France provide clear evidence of the problems that arise, with rogue vessels being regularly reported,'
says Dr Anderson. 'Apart from increasing the risk of collisions, masters and owners of contravening vessels can face
criminal action, heavy fines and costly delays.'
. We sought the opinion of Jersey radar engineers. They
were 99% certain
that both of these tracks were ships on shipping lanes that were clearly visible on . . .
playback of Guernsey PSR data
n12Email from Simon Langlois to David Clarke 26.09.07. No
obvious UAP echoes could be identified and specifically there appear to be no interesting plots corresponding to the
UAP positions triangulated in Fig.7. However this is inconclusive.
As Paul Kelly initially pointed out in his CAA report, and as was also acknowledged in the MoD response (Appendix A), echoes from stationary reflectors showing small or zero pulse-to-pulse phase difference could have been entirely eliminated by the moving target indicator (MTI) which was operating on the radar. The impression of Capt Bowyer, supported by the consistent triangulation of lines of sight developed in Section 3, was that the visual UAPs appeared to be either stationary or very slow moving.
Examination of Fig. 11 reveals, aside from skin paints of known transponder traffic (purple curves), numerous other primary echoes in the area which were evidently not suppressed by MTI. Some tracks appear which may be VFR light aircraft operating at low altitude or possibly small boats, but there are many isolated plots and short, erratic tracks.
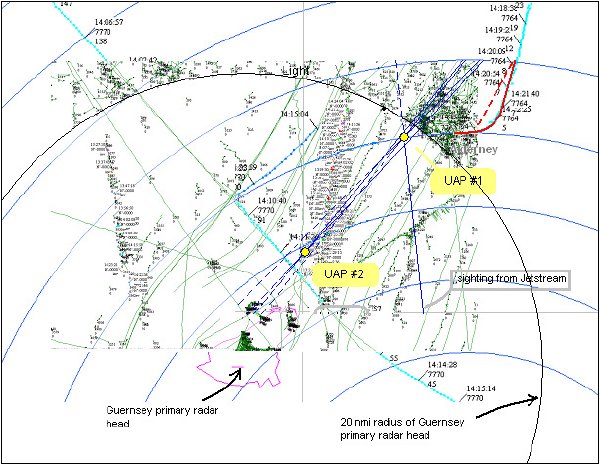
The nature of this clutter background is uncertain. Moving targets such as birds and even sea waves are examples of reflectors that might get through a broad MTI gate. In Simon Langlois' opinion most of the echoes are very unlikely to be due to birds because of range from the antenna, and unlikely to be sea return because of small wave heights in the prevailing weather conditions. However we found (Section 5) evidence of moderate radar super-refractivity which could have contributed to increased transient clutter from weak surface echo sources. We were advised by Simon Langlois that although the range-azimuth gate on the Jersey MTI filter was set at maximum (setting #3), for maximum suppression of clutter and irrelevant slow targets, the Guernsey radar is customarily operated with MTI rejection at a lower setting and therefore picks up a larger number of primary echoes. The vast majority of the non-aircraft targets appearing in Figs 11 & 14 were detected by the Guernsey antenna.
It will be seen from Fig.14 that many of these echoes have been suppressed within a 20nmi radius of the Guernsey antenna. This was done by Jersey ATC radar engineers at the request of Capt Bowyer in order to clarify the two tracks (A and B in Fig 12) now suspected to be ships. Clearly the density of transient clutter echoes within this radius is greater than shown, and conceivably there could be traces of slow-moving primary targets near the triangulated UAP locations which are suppressed in this view. Even outwith this 20nmi radius it is possible that dense knots of tracks (e.g., at the top right, near Alderney) could obscure echo from a slowmoving primary target. Perhaps the triangulation contains sources of error?
Clearly a complete analysis of all primary plots is required, for which we await the result of the GEIPAN analysis.
But whilst granting the limitations of our study, we feel it advisable to caution that there may be no conclusive test
for separating anomalous signal out of the noise background. We were informed by ATC radar engineer Simon Langlois
n13Ibid that the raw primary echo data is irrecoverably processed and digitised at the radar
heads before being fed to the radar control room in the form of plot-extracted symbols n14This is a common engineering solution to the problem of bandwidth. A plot extractor (sometimes called target
evaluator
in the US; related terms include Automated Detection and Tracking [ADT] and track-while-scan) uses
predictive software to associate tracks to targets and smooth the update rate. It produces a synthetic visual display
which has greater clarity, track continuity and brightness than the blips
updated only once per scan on a traditional
PPI. It is also easy to insert alphanumeric target information in real time into the video and so the burdens on the
operator are greatly eased. Moreover the information in the raw radar pulse forms is bandwidth-hungry, requiring
special cabling between antenna and display, which is not always practicable. So if the plot digitisation is done at the radar head the bandwidth required for data transmission between the antenna and the display can be reduced by a
factor of perhaps 10,000 from Mhz down to a few hundred Hz, allowing the use of ordinary telephone landlines or
radio channels so that antenna and display can if necessary be separated by the ocean, as in this case. .
Thus even if slow-moving radar-reflective UAPs in the area did return primary echoes whose velocity exceeded the MTI
rejection threshold (perhaps only transiently) n15Glint echoes from essentially stationary targets might also lead to detection. Radar echo is generally the sum of
many different wavefronts with different phases, and where an asymmetrical object or an object with a complex
structure undergoes rotation without bulk translation the phase centroid of the echo might move outside the
geometrical volume of the reflector. If this displacement is sufficiently large and/or rapid it might defeat the MTI
filter., the type of echo-diagnostic scope presentation cues traditionally available to primary analogue
radar operators are permanently lost. It may remain impossible to confidently distinguish a significant plot from the
background of insignificant clutter plots.