Prior to obtaining the complete Jersey ATC radar data for the sighting period n1Thanks to the mediation of Capt Bowyer and the kind assistance of Jeremy Snowdon and Simon Langlois of Jersey ATC. See Section 4. we were able to study several composite screenshots produced by the ELVIRA n2Enregistrement, Lecture et Visualisation d'Information RAdar is the French industry standard format for ATC radar data management used also by Channel Islands ATC. software. Most importantly these showed secondary radar plots during the sighting period aggregated onto single images at various scales, enabling us to identify and map accurately the courses of the several aircraft involved. The true altitudes and the instant pitch and yaw of the Trislander (which are not necessarily identical with the course and slope of the flight track) will also assume importance in an accurate 3D reconstruction of lines of sight.
At the time of the initial call to Jersey (14:09:33Z) the Trislander had not yet entered the Channel Islands Control Zone, but had been visible for some minutes on Jersey radar with the "squawk" number (transponder code) 7764 and the altitude report "40[hundreds of feet]".
Capt. Bowyer initially estimated (see Section 1) that UAP #1 was near the ORTAC reporting point and no more than about 15 nmi from the aircraft. The radar plot shows that the Trislander was 15 nmi from ORTAC at approximately 1404:30. According to Kelly's written report the first sighting was at 1409, when 5-10nmi from ORTAC. However Capt Bowyer estimated that 2-3 min passed before his first message to Jersey Control, which is timed on the ATC audio log (Section 2) as 1409:33 when the radar plot is at about 5-6nmi from ORTAC. These figures cannot be exactly reconciled. The best-fit approximation is that the first sighting occurred when at a position about 12 nmi from ORTAC at 1406Z, ~3.5 min before the first radio call to Jersey ATC.
Paul Kelly records the reported time of sighting of UAP #2 as 1416, which is in conflict with the time of 1410 handwritten on Capt Bowyer's CAA report n313 Capt Bowyer's report contains handwritten annotations by an Alderney Flight Operations official (name blacked out) on this same page. The time of 1410 appears here in notes written "after conversation with [Capt Bowyer]", as well as next to Bowyer's drawing. It may be that the Ops official is responsible for both entries although this is unclear.. 1416 is also in conflict with Capt Bowyer's statement that UAP #2 was first seen when the plane reached the approximate position of the ORTAC reporting point, since the radar plot shows that this occurred a little after 1412. Given a normal degree of narrative approximation "1410" can probably be reconciled with 1412-13 (at 1410 the plane was a few miles and a couple of minutes from ORTAC at 115kt GS) being shortly before the appearance of UAP#2 was reported to Jersey Zone at 1414 (radio transcript, Section 2). The origin of Kelly's "1416" remains uncertain.
Another feature of the Trislander's radar plot is a small but quite noticeable drift from the nominal 207° heading on R41 to about 212° after ORTAC (Fig.6). We wondered if Capt Bowyer had disengaged the autopilot and turned towards the UAPs out of curiosity. Questioned about this Capt Bowyer stated that he did not recall having turned deliberately towards the objects at the time n4 He considered doing so, as he told the Guernsey Press & Star (26.04.07): "As I got closer to it, it became clear to me that it was tangible. I was in two minds about going towards it to have a closer look but decided against it because of the size of it. I had to think of the safety of the passengers first." and that the autopilot remained engaged continuously until about 1 mile from Alderney.
He suggested that he may have rotated the aircraft slightly, without disengaging the autopilot n5 The CAA "Check Flight Certificate" form for the BN2A MK3 Trislander (CAA CFS 159 issue 1, Section 12.6) instructs that with the auto-pilot engaged a load is to be applied to each main flying control to ensure that the pilot is able to satisfactorily "overpower the auto-pilot." , perhaps because the wide windscreen divider was obscuring his view of UAP#1.
It was possible to correct an unexplained error in the 1420Z landing time given in the CAA report. At 1420 the Trislander was still above 800 ft and about 5nmi N of Alderney. The final radar plot indicates that touchdown on the tarmac of runway R26 was after 1423 n6 A noteworthy feature of the logged flight times is that the Southampton-Alderney trip was 7min shorter than the previous Alderney-Southampton trip despite an adverse headwind. This was resolved by Capt Bowyer as being due to the miles consumed in overshooting Southampton and making a turn around for a landing headed SW..
Examination of the radar plot also discloses an ambiguity in the recorded altitudes, which are based on SSR transponder reports of the plane's pressure altimeter reading. These appear on- screen graduated in steps of 100ft from "40" down to the final reading of "1" (=100 ft) at touchdown. At first sight this is confusing since runway R26 at Alderney airport is at about 290 ft elevation. The reason is that these are reports from the plane's pressure altimeter, not true altitudes ASL, and require adjusting according the difference between the standard flight level pressure calibration (QNE) and the local pressure (QNH).
The radar plot of the Blue Islands Jetstream also allowed some previous confusion to be resolved. The location recorded by Jersey Air Traffic Controller Paul Kelly in his CAA report was about 5nmi northeast of Sark, which is in conflict with the pilot's own report to CAA giving 5 nmi northwest of Sark. Examination of the radar recording shows that the Jetstream was never at any time 5nmi northeast of Sark. It did pass close to 5nmi northwest of Sark, but shortly after 1412Z when its altitude was about 6500ft. The radio transcript (Section 2) proves that the pilot had the UAP under observation some 3mins later, at 1414:43 and probably until at least the end of his transmission to Jersey Approach at 1415:12, which suggests a position approximately 3nmi due E of Sark. Of course the aircraft is travelling SE at ~ 4.2nmi/min and descending, so the change of position is substantial during the estimated duration of about 1 minute. At 1414:43 the radar plot indicates a pressure altimeter height of about FL42, or possibly ~ 4400ft ASL when corrected for QNH of 1021mbar. If the report was made near the beginning of the observation then it would terminate near FL29 at 1415:43, or about 3100ft ASL. This seems consistent with the pilot's later report of "passing through 3500ft" at the time.
We now wish to integrate the radar track and height information with the timed transcript of radio communications given in Section 2, and the witness narratives summarised in Section 1, in order to evolve the sighting geometry in three dimensions. From this we will attempt to measure accurately the azimuth and elevation angles of the different lines of sight (LOS).
As already mentioned, the indicated radar altitudes are produced from SSR transponder reports based on the international standard altimeter pressure setting. The Trislander's cruise altitude, for example, appears as "40" on the radar plot. This stands for Flight Level (FL) 40, which means that the altimeter is reading 40 hundreds of feet or 4000 ft above a notional sea-level pressure of 1013 mbar n7 There are several different types of aviation altitude measure and UK airspace has controlled and uncontrolled sectors where conventions differ. Essentially, true pressure altitude (ASL) is used at low level, then there is a transition level, above which common calibrated pressure levels are used. Which convention is being used depends on where the transition level occurs, which varies from country to country and region to region. In uncontrolled UK airspace the transition level is normally 3000 ft. This is very much lower than in the US for example. The CAA Manual of Air Traffic Services gives the Quadrantal Rule for flight levels to use on different headings (Table 1) from which we can see that the Trislander's Flight Level in cruise as it approached the Channel Islands Control Zone was required to be FL40, 60 or 80 etc. All aircraft at a given Flight Level are thus actually confined on a common isobaric surface which preserves altitude separation regardless of local variations in atmospheric pressure. When descending through the transition level at 3000 ft the altimeter would be reset to the true local pressure (QNH) given to the pilot by ATC and it will then read true altitude ASL; however the transponder altitude reports sent to the radar will continue to be referenced to the FL pressure setting (QNE) of 1013 mbar. The true altitude ASL will be found by adding the equivalent height corresponding to the pressure gradient between 1013mbar and the local surface pressure. This leads to a true cruise altitude of approximately 4216 ft ASL and all subsequent radar altitudes must be adjusted by the same +216 ft n8 Capt Bowyer stated, "The general average feet setting for one millibar of pressure increase is ~30ft, in fact the ICAO adjusted ft per mbar is 27ft. Obviously the height difference per millibar increases with altitude as pressure decreases. The standard pressure setting for all aircraft using flight levels is 1013mbar, so if the ambient sea level pressure is 1021 this equates to 8 mbar above Standard or 8x30ft or 4000 ft plus 240 ft. As altimeters are only accurate to +/- fifty feet this is deemed a sufficient rule of thumb adjustment." (email to Martin Shough, 05.08.2007) (Thanks to the fact that FL1 corresponds to a true altitude of about 100 + (8 x 27) = 316 ft the last altitude report then places the Trislander about 30 (+/- 50) ft above the tarmac instead of 189 ft underground.)
| Magnetic Track ° | Cruising Level |
|---|---|
| More than 360 and less than 90 | FL 30, 50, 70, 90 etc. up to FL190 |
| More than 90 and less than 180 | FL 35, 55, 75, 95 etc. up to FL175 |
| More than 180 and less than 270 | FL 40, 60, 80, 100 etc. up to FL180 |
| More than 270 and less than 360 | FL 45, 65, 85 105 etc. up to FL185 |
First consider the lines of sight shown in plan in Fig.7. This construction is dictated by certain constraints and assumptions coming from witness descriptions and sketches (see Fig.10 & Appendices A & B), as follows:
- The 1406 line of sight (LOS) to UAP#1 lies approximately 7° to the right of 12 o'clock from the Trislander ("slightly to the right", "a few degrees to the right", "5-10° to the right" n9Over the radio Capt Bowyer initially described #1 as "in my 12 o'clock" and "dead ahead". Granting some approximation, clearly the angle is small and perhaps one feels it ought to be less than 7° . In fact when we allow for the crabbing angle of the aircraft due to the wind vector (see below) we find that the bearing of UAP#1 relative to the aircraft axis could be as small as about 3° and still be at 7° from the plotted course.)
- Both LOS#1 and LOS#2 lie at all times to right of the flight track
- Both LOS#1 and LOS#2 pass to the left of the Casquets Lighthouse (Capt Bowyer). Casquets is ~12° right of the flight track after ORTAC)
- Initially LOS#2 is approximately 1° to the right of LOS#1 (Capt Bowyer's drawing in Fig.4 shows about one object width between object centres) n10 A small angle is clearly implied in the real-time radio description (Section 2) and Capt Bowyer has explicitly confirmed that Fig.4 shows how the UAPs were initially positioned. His Diagram 5 in Fig.10, suggests about 4° but this is only a schematic sketch. However Paul Fuller's interview (Appendix A ), contemporaneous with Diagram 5, gives "perhaps 10 degrees" as the initial separation, which is clearly discrepant. Later discussion with Capt Bowyer suggests that this figure originates in a misunderstanding and was given as an estimate of the angle by which UAP#2 was offset from 12 o'clock, rather than from UAP#1. The original question - "Where was the second light in the sky ? Was it above/below/same level, to the left/right/straight ahead ?" - was arguably ambiguous as to the point of reference.
- By about 1416, both LOSs appeared to "line up"
- By 1418 the LOS to #2 is about 2° - 3° to the left of #1
- Also by 1418 the bearing of the LOS to the pair of objects had rotated to lie about 20° to the right of the flight track
- Capt Bowyer judged that UAP#1 appeared to be approximately 2nmi S of the Casquets Light
- Capt Bowyer judged that UAP#2 appeared to be approximately 10nmi SSW of UAP#1
- Capt Bowyer judged that both UAPs were stationary (or very slow moving), and that apparent relative motions of both UAPs were parallax changes due to the motion of the Trislander
As can be seen by inspection of Fig .7, when these conditions are locked into the framework of the radar plot, with a freedom of only a degree or so, the result is a somewhat self-consistent triangulation of positions. There seems to be only one unique combination of lines of sight which satisfies in the simplest way, and with a very small margin of adjustment, the basic requirements of Capt Bowyer's observation. It is notable that the implied position of UAP #1 lies within a few degrees of the 8 o'clock position reported by the Jetstream pilot, Capt Patterson (the LOS to the second would have been too far behind the Jetstream).
We can go further. Between 1406 and 1418 the angular sizes of both UAPs grew larger. The estimated angular width of UAP#1 increased from ~0.5° to ~1.25°, corresponding to an enlargement factor of between 2.14 and 3.0 n11Apparent sizes at arm's length, 6-7mm to 15-18mm at 75cm, were estimated during Capt Bowyer's interview with Paul Fuller at Southampton Airport, 8 June 2007. The mean of these values (2.6) is very close to the ratio (2.8) of the two distances from the aircraft to the triangulated position of UAP#1 at these times. In other words, to an unusually good approximation, the apparent angular sizes increased by the factor that they should have done during the Trislander's approach if the UAPs were stationary objects of fixed real size at the triangulated locations.

During the time from 1413 to 1418 during which both UAP#1 and UAP#2 were visible their average distances from the observers are in the ratio 1:1.72. If both were the same physical size this would lead us to expect their angular sizes to be in ratio 1:0.58, or in other words that #2 would be slightly more than half the angular width of #1. Capt Bowyer estimated that "The second light was . . . slightly more than half . . . of the size of the first light" (Paul Fuller's interview). His sketch (Fig. 4) shows a ratio of 1 : 0.54.
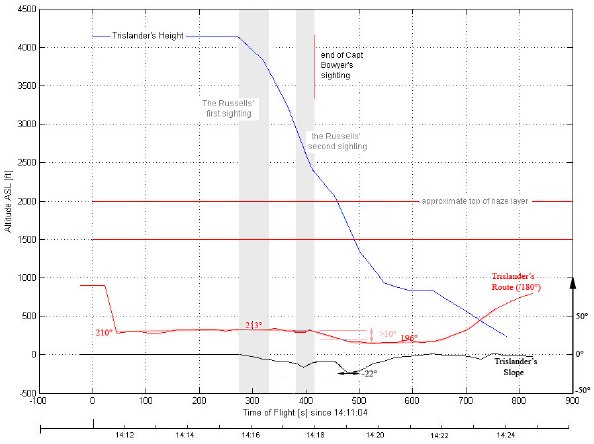
The bearing of the objects relative to the aircraft changed significantly towards the end of the observation. The estimated 20° LOS rotation occurring before the final sighting time of 1418, as shown in Capt Bowyer's Diagram 5 (Fig.10), is quite closely reproduced in Fig.7, where it can be seen that at least part of this rotation n12 One would expect the angle to be if anything somewhat less than 20° , consistent with the well-known tendency of observers to overestimate visual angles. would be accounted for by the rotation of the aircraft coordinate frame during the start of the turn. The magnitude of the this component can be best gauged from the red curve in Fig.9, plotted by computer from the radar data, which shows that prior to visual loss (fixed by the radio transcript as being somewhat prior to 1418:03, the time of the transmission reporting it) the change of course can hardly have been more than a few degrees. The maximum course alteration approaches 16° only after another minute or more. Therefore we conclude that in addition to a small rotation of relative bearing there was a real rotation of azimuth, probably in the order of 10°. This is closely consistent with the angle (almost exactly 10°) measured between the initial (1406) and final (1418) LOSs in Fig.7, so that the sum of both components of bearing rotation is again consistent with parallax due to motion of the plane in relation to stationary objects at the nearby locations triangulated.
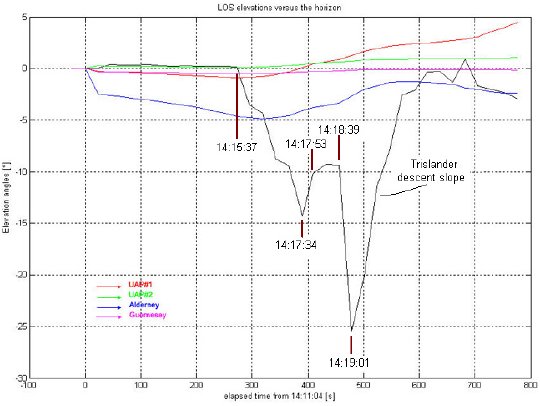
Looking at the third dimension of Fig.7, the descent slope of the aircraft taken from the radar plot is graphed in Fig.8. The angle increases fairly steadily from zero at a rate of ~10 arcsec/sec at 14:15:30 towards ~14° at 14:17:30, then sharply decreases at the same rate (i.e., the nose comes back up a little) for some 25 sec, reaching a plateau at around 9° for almost 40 seconds, then increasing sharply once more at ~14:18:40 for a final 23 sec towards a maximum depression angle of 25° at 1419 before levelling off to make the landing approach.
We know from the radio recording that the final visual loss in haze occurred at approximately 1418, so this curve fixes the Russells' second (and last) sighting in the dip, between about 1417 and 1418, when the slope steepens beyond about 10°. This occurs around the start of the turn from ~212° to ~190°. Kate Russell said that in this second sighting the UAPs' yellow colour was deeper. John Russell's account is consistent with this: He said that the one brilliant light he saw (both UAPs would still have been very close to aligned at this point, in azimuth, from Fig.7, and in elevation, from Fig.8) looked "orange" and appeared to him to move a little to the right during his sighting (W) which is consistent with rotation of the aircraft to the left during the start of the turn.
The graph of Fig.8 shows only a small reduction in the descent slope during the minute or so after 1415:30, no pronounced pitch-up that would coincide with the end of Kate's first sighting. But the slope of the aircraft is interpolated from height plots at approximately 1.56nmi intervals, and it's very possible that the curve smoothes out changes in the aircraft pitch during the 56 seconds and 300ft of descent between successive height reports at 1415:26 and 1416:22.
At first sight one aspect of Kate Russell's account is in conflict with this construction. Kate saidn13 Telephone interview with David Clarke. that when the nose dipped for the first time she looked and could see two lights through the front windscreen, one of which was "roughly where I was expecting the airport to be (over Alderney)" n14 The passenger seating positions in relation to the high instrument panel, and the slight nose-up cruise attitude of the Trislander, mean that the horizon ahead would not be visible until the angle of descent reached a few degrees. . But Capt Bowyer did not at any time see the UAPs over Alderney, rather they were some degrees further to the west. Fig 7 predicts that when first seen the bearing to UAP#1 would have passed directly across the centre of Guernsey. From the time of Kate's first sighting the triangulated LOS lies over the west side of Guernsey, between about 10° and 15° to the right (W) of the bearing to Alderney.
This is a puzzling discrepancy, but one which (one feels) must have a simple explanation. Indeed a reasonable explanation does exist as follows:
Just after the start of descent at 1416 Alderney was about 13nmi away and would appear about 10° across at a small depression angle of a few degrees. The larger island of Guernsey was about 35nmi away, nearer the horizon, and would appear about 8° across. Capt Bowyer states that both Alderney and Guernsey were visible before descending to the haze although visibility was somewhat poor.
Kate was "expecting" Alderney to be almost dead ahead of their nominal 207° course on R41, so when the nose dipped at about 1416 and a hazy island of about the right angular size rose into view she could reasonably believe it to be Alderney. But in fact the radar plot shows that the aircraft's heading had departed from 207° shortly after the second object was seen when passing ORTAC (see Section 3, Fig.6), and at 1416 was about 212°. The island most nearly ahead of the aircraft would be Guernsey.
Moreover, this effect would be increased by the wind correction or "crabbing" angle of the aircraft. This is the difference between the instant heading and the average course of the aircraft due to the need to compensate for the wind vector. Unless the wind is dead ahead, dead astern or zero knots, there will always be a some rotation of the aircraft coordinate axis relative to the course flown.
The Indicated Air Speed (IAS) shown in Capt Bowyer's CAA report is 130kts. Taking 130kts IAS as equivalent to about 140kts TAS n1525 This is a standard correction proportional to altitude. It is necessary because the onboard airspeed indicator does not automatically recalibrate itself for variation in air pressure. and plugging in the forecast 8 kt SW wind (from the same report) only gives us about 1 deg correction n16These computations are traditionally performed by pilots using a hand-held calculating device known as an E6B. We have employed an on-line digital emulation of an E6B available at https://www.csgnetwork.com/e6bcalc.html. But 8 kts at over 4000ft does seem light compared to the weather reports and surrounding balloon ascents. The Met Office Form214 forecast, and Brest and Camborne noon ascents show 20, 19 and 23kts respectively at the flight level, from 230°, 236° and 220° respectively (see Section 5). Allowing 20-25 kts from 220-230° gives between 2° and 4° of crab angle, and a ground speed around 116 kts - which is close to the average 115kts we can measure on the radar plot for the pre-descent period 1405:42 - 1415:36.
Thus the aircraft axis could be rotated as far as about 216° azimuth at the time of Kate Russell's first sighting, in which case a LOS dropped from the aircraft centreline would run roughly across the middle of Guernsey n17 This possible difference between forecast and actual winds brings to mind the discrepant 1420Z landing time given in the flight log, at which time radar shows the Trislander still about 5nmi N of Alderney. We can measure the cruise speed for the pre-descent period 1405:42 - 1415:36 from the radar plot at about 115kts GS. But the logged times 1339-1420 give 41mins in total, tarmac to tarmac, which would equal about 119kts average GS over 81.2nmi linear distance, and since the true trip distance includes climb out, a small off-course westerly deviation, and slowing/manoeuvring for approach, a max cruise speed even higher than 119kts is implied. The difference between the logged trip time and the radar-measured trip time is about 8%, equivalent to about an extra 10kts adverse wind, adding which to the flight log's forecast 8kts brings us close to the ~20kts that we get from other weather data (the adverse wind vector would not be 100% of the wind velocity). It may not be a coincidence that a forecast landing time on the basis of 8kt winds would have been close to the logged (and erroneous) landing time..
Being more distant Guernsey would of course be at a smaller negative elevation than Alderney, i.e. would be closer to the horizon, and would be the first to appear as the nose dipped. Kate's view past Capt Bowyer (in the left cockpit seat) from her passenger seat three rows back could well have been restricted in the direction of Alderney - slightly lower and to the left of the flight track. It is clear from Fig.8 that the smoothed-over difference in pitch angle that is sufficient to reveal and conceal the UAPs for Kate's first sighting cannot be large, and is very unlikely to exceed 5°. The difference in elevation of Alderney and Guernsey at this time is about 4°. So if a UAP which "appeared to be over the land (Alderney)" was really above Guernsey then Alderney cannot have been far above the bottom edge of the windscreen, as well as being displaced by almost 20° to the left of the field of view where it was most likely to be obscured by the pilot.
This first sighting, said Kate, lasted "a few minutes" until the nose came up again and obscured the UAPs and the island. It appears the duration was somewhat less than this. Fig.8 permits room for only perhaps 90 seconds or so between the start of descent and Kate's second sighting, occurring shortly after 1417. By 1418 the plane was descending towards the top of the haze layer at about 2000ft and near-horizontal visibility reduced dramatically. Guernsey was now lost to view, and at the same time Capt Bowyer had reduced the slope of descent from about -14° to -9°, i.e., the nose came up about 5°, between about 1417:35 and 1418. At this time all parties lost visual contact with both UAPs. By the time the plane emerged through the haze at about 1419 on a steeper descent slope (25°) it had completed its turn of about 16° onto a course towards the E of Alderney for final approach and landing on Runway 26. At this time Alderney itself at a distance of only ~7.5nmi would be over 20° wide and filling the centre of the windscreen.
In short, it seems possible that Kate could have been unable to see both Guernsey and Alderney simultaneously at any time during this descent and could have mistaken one for the other, which would explain an otherwise puzzling contradiction.

The LOS elevation angles in Fig 8 are computed for UAP heights of 2000ft ASL, the estimated altitude of the top of the haze layer. Capt. Bowyer's impression was that the UAPs were phenomena that finished up located in or near the top of the haze layer, somewhere between 2000 and 1500ft. It is interesting to note that by assuming this rough figure then the changing sighting geometry implied in the several sighting narratives seems for the most part internally consistent.
Initially UAP#1 was visible on or close to the sea horizon n18Capt. Bowyer points out that the thin haze layer and the sea surface are effectively merged at the distant horizon. on a LOS that runs across the island of Guernsey, over 50nmi away at the time and therefore also quite close to the horizon (about 69nmi away from 4200ft ASL). As the plane approached in level cruise, the LOS to #1 rotated a few degrees to the W, whilst at the same time the apparent size of the UAP increased, and the depression angle to the UAP grew a little steeper. This last effect was acknowledged by Capt. Bowyer as difficult to judge bearing in mind the curvature of the earth, but he estimated that at the point just before he began his descent, at about 1415, the depression angle had reached a maximum of approximately -2°. (At this time the relative elevation of UAP#1, if at 2000 ft ASL at the triangulated position in Fig 7, would be about -1.5°.) The depression angle to the island of Guernsey, however, over 4000 ft below, had increased more rapidly n19 To some -6° below a horizontal plane tangent to the track of the aircraft, which has a radius of curvature = earthradius + 4200ft, and almost 5° below the geometrical earth horizon. so that the UAP was now visible against the backdrop of the sea beyond. Thus the changing elevations were such that during the sighting UAP#1 was seen "against [both] the sea and the island" (#2 having meantime been observed some degrees to the right of #1 and appearing always above the open sea n20Is it possible that UAP #2 may have been obscured in the haze prior to sighting at 1412? This is Capt. Bowyer's opinion. He points out that #2 appeared to be in the lee of Guernsey, where SW winds may have "pushed up" the haze layer. Other explanations, such as mutual occultation or mirage/reflection effects etc, are of course possible.).
Just as Capt. Bowyer acknowledged clearance to descend to 2000ft at 1415:43 he reported to Paul Kelly that the UAPs, which had grown larger, were now "very plain to see . . .without any binoculars". It was just after this that he started descent and Kate Russell saw the UAPs through the front windscreen against the backdrop of the sea, even apparently "coming out of the sea" as it appeared to her. We have seen that they would have appeared above the bottom edge of the windscreen by only a few degrees. Guernsey, a few degrees below UAP#1, would have followed them, rising into view just enough to be mistakenly identified as the aircraft's destination (Alderney), before the pitch angle reduced once more after a few tens of seconds and the objects were briefly lost to Kate's view. At this time the plane was still perhaps 1500ft or so above the haze layer.
The UAPs were still being watched by Capt. Bowyer who reported to Jersey Zone at 1417:14. that the UAPs seemed to be below him at about 2000-1500ft ASL, i.e., close to the top of the haze layer. He noticed that as the descent continued the relative elevation of the UAPs began to rise again, i.e. the depression angle diminished, tending back towards the horizontal, whilst at the same time the vertical separation of the two lights also decreased n21The vertical separation of the two UAPs reportedly reduced by approximately ½ between the time #2 first appeared at ~1413 and the final disappearance at ~1418. The initial vertical separation as drawn by Capt Bowyer (Fig 4) is about 1/3 of the angular width of UAP #1, which, interpolating between the terminal values of 0.5° and 1.25° , gives ~0.9/3 = 0.3° (very close to the 0.4° we get for two objects both at 2000ft positioned as in Fig.7). The final vertical separation ought therefore to be about 0.15° . The final vertical separation was estimated as 6 - 8 times the vertical depth of UAP#2. The mean of the aspect ratios of the UAPs depicted in Capt Bowyer's two larger scale drawings (Figs 2 & 3), about 13:1, leads to a value for the final vertical depth of UAP#2 equal to ~0.65/13 = 0.05° , and 6 x 0.05 = 0.3° , or the same as the initial separation. So it appears we do have here a factor 2 inconsistency between one minor element of the report and the geometry of Fig.7. But Capt Bowyer did add the specific disclaimer that his judgment of 6 - 8 times the vertical depth of UAP#2 was probably unreliable owing to the deceptive lateral offset between the two UAPs. In terms of typical witness estimates of quantities this is an extremely small error and would scarcely be notable at all were it not for the exceptional consistency of other linear and angular ratios..
At about this same time, with the plane about 1100ft above the haze, the nose of the plane dipped a second time and Kate Russell was afforded another view of the objects. The azimuth separation between UAP#1 and #2 was still near zero, and both objects appeared very close together. At this time John Russell was able to lean across and obtain a brief view. He was only able to discern one brilliant "lozenge" of light, appearing to him as "orange" in colour, drifting a little to the right as the aircraft turned towards Alderney.
But Capt Bowyer was able to observe that the lines of sight to the two UAPs continued to cross, until at about 1418, when nearing the top of the haze, #2 had moved a couple of degrees to the left of #1. And they no longer appeared to be below his altitude. They now appeared to be almost level with the plane. Almost immediately after entering the haze they were finally lost to view.
This geometry is not inconsistent with the report by the Blue Islands Jetstream pilot, Capt Patterson, who observed a large "oblong" or "oval" object of hazy outline, having a yellow colour, at the bearing and range of the UAP#1 position triangulated in Fig.16. Moreover Capt Patterson reported at 1415:08 that the apparent altitude of the UAP was possibly 2000ft below him, i.e., at about 2000ft ASL n22Note that the radar plot allows us to see that Capt Patterson's line of sight to his indicated UAP position 20nmi away would fall aft by some 10° during his sighting, and the relative height would change by ~1300ft or about 0.5° of elevation. His judgments of geographical location (just NW or W of Alderney) and altitude are therefore themselves tested by triangulated lines of sight and a degree of parallax..
It is interesting to note that the radio transcript proves these altitude estimates to be independent of one another. Capt Patterson had been listening to the exchanges between Capt Bowyer and Channel Islands Zone, but Bowyer had earlier said that he thought the object was at his level (FL40). Kelly asked him to confirm this at 1412:36, which he did. That was the last height reference before Patterson's report at 1415:08. Similarly, when Bowyer reports to Zone at 1417:14, "Low to me now, er, I'd say 2000 feet, 1500," he doesn't know about Patterson's report, which was made on a different frequency to Jersey Approach Control. At this stage it appears that Zone Controller Paul Kelly doesn't know about it either, and he certainly does not make any mention of it to Bowyer.
A final point of interest is that Capt Patterson does not initially see anything when he is passing Guernsey at about FL70 - 65. At this time he confirms to Kelly that he has overheard the transmissions from Capt Bowyer and knows what he is supposed to look for, but replies there is "nothing at all" in the area.
This perhaps argues against the suggestion that Patterson, primed by hearing the report, is oversensitised to the possibility of seeing something unusual and is thus compromised as a reliable witness. He is not reporting something just because he's asked to. He looked for over minute before saying he could see "nothing in that position at all, I can't see anything" at 1413:13.
But then a couple of minutes later when down to about FL40 he does see an object "answering the description" in the correct area, and he watches that on and off (in between flight duties) for about a minute, reporting it to Approach Control. He apparently took this seriously enough to put it in writing in a report the next day under the heading "Unidentified Flying Object NNW of Alderney", repeating that he saw an object "fitting the description" and signing his name n23 Blacked out of course in the copy released by MoD (reproduced in Appendix A). to it.
Obviously it is true that Capt Patterson knew roughly where to look and knew the description Capt Bowyer gave over the radio - that, after all, is how he is able to say that his object "answers the description". But there is no evidence of undue influence. Indeed there is proof of independence in respect of a significant quantitative judgment, and Patterson's actions in observing and reporting imply caution and deliberation on his part.
This object appeared ill-defined and little more than an oblong hazy patch. But the observer noted that he had not seen anything like it before on this route, or indeed on any other. It was a significant angular size and its estimated Trislander-yellow brightness of colour (taking account of haze extinction) is noteworthy. Pressed for an explanation he suggested that a large balloon or airship, possibly military, might resemble what he saw, or perhaps an unusually sunlit guanocovered island near Alderney. (It was established by questioning that the island of Burhou NW of Alderney was simultaneously visible and the object was estimated to be somewhat further west.)
But it was "probably not at sea level and not attached to the land". His best guess is that it was some sort of atmospheric phenomenon.
The physical size was bracketed with two estimates: Possibly 4 or 5 times the 50ft length of a Trislander fuselage (200-250ft, 61-76m) but 0.5 NM (~900m) maximum, estimated by comparison with the nearby island of Alderney. The latter is a factor 2 larger than the size indicated by Capt Bowyer's angular estimate, but the observer does say that this is a "maximum".
The mean of his two disparate estimates is ~485m n24 Capt Patterson's impression of a ~70m physical length, based on mental comparison with a Trislander at the range of Alderney, may have been influenced by an underestimated range. The CAA report records his estimated range as 10nmi when Alderney was more like 17nmi, so correcting by a factor 1.7 would give us about 115 metres. (It is reasonable to infer that this was a visual range estimate reported by Capt Patterson since any figure introduced by Channel Zone controller Paul Kelly could only have been based on the radar plot and ought not to have been in error). On the other hand, in making the direct comparison with Alderney, how accurate was Capt Patterson's judgment of the true cross-sectional width of the island from this perspective? Perspective foreshortening of the obliquely oriented island would present an image whose angular width, if taken for the known map length of the island, would tend if anything to act as an inflated yardstick. This could lead to an overestimate of physical length, meaning that we should possibly reduce somewhat the estimated "maximum" of 900m. But if we assume that these unevaluable sources of error, of opposite sign, simply cancel out, then we find that the mean of his two stated estimates is a bit less than 500m, of the same order as the size implied by Capt Bowyer's angular estimates. It is interesting to compare this with values earlier derived from Capt Bowyer's sighting geometry: Approximately, initial angular size of 0.5° @ 35NM = 560m; terminal angular size of 1.25° @ 12NM = 460m; mean, 510m.
On the whole we have to say the reports show a notable degree consistency on most indicators if interpreted as observations of some large object or feature at the triangulated location. Of course one of many questions arising is this: If Jetstream (like the FlyBe 146 in a similar position a little later) could not see anything at 1413 from above FL65 and reciprocal to the Trislander's LOS, why not? We discuss this and many other issues in relation to the hypotheses introduced in Section 6 and the conclusions offered in Section 7.