Lenticular or lens-shaped clouds (lenticularis) are a type of lee wave cloud distinguished by an often striking symmetry and smoothness. These form due to standing gravity waves in the airflow when humid air is forced upward over an obstacle in conditions of static stability (i.e., minimal vertical circulation). The classic form is altocumulus standing lenticularis.
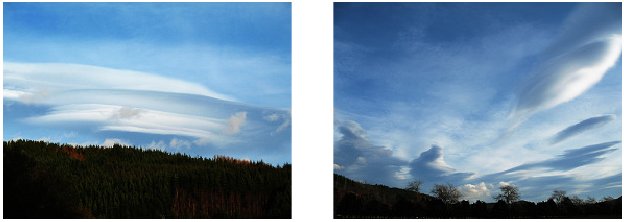
Well-developed lenticulars are generally seen when strong winds are deflected by high hills or mountain ranges (for which reason they are also known as orographic, or mountain-formed clouds), and the amplitude of the waves in these cases can reach tens of thousands of feet. The clouds form at altitude in the ascending moist air at the peaks of the waves, often above the freezing level so that they are sometimes composed at least in part of ice particles. These mountain clouds are typically large, often miles across. Given sufficient wave amplitude they can appear as approximate lens or almond shapes, or like stacks of elliptical plates with smooth surfaces and well-defined edges (Fig. 33).
A distinction is made between vertically trapped lee waves, and untrapped or vertically propagating lee waves. Gravity waves can only exist in statically stable air. The trapping occurs where a stable layer at the barrier crest is sandwiched between unstable airmasses which are unable to support gravity waves. It is these trapped waves whose signature, when wave amplitude is high, is the lenticular cloud proper (see Fig.33). They are also characterised by a small vertical directional wind shear (i.e. little change in wind direction with height) and require an abrupt escarpment on the lee side of the barrier, the windward profile being relatively unimportant n1 https://www.caem.wmo.int/_pdf/turbulence/OrographicTurbulence.pdf. Untrapped waves, on the other hand, occur when the atmosphere is stable through a considerable depth and the waves are free to propagate upward. They generally occur in the presence of marked wind shear aloft and can be set off by broader mountain ridges. The signature cloud of these waves is usually a less compact higher-altitude cirrus form called orographic cirrus.

Strong winds approaching Beaufort force 7 (moderate gale) in the stable layer are usually considered the minimum necessary for mature trapped lee wave clouds to form. A figure of at least 20 knots is widely cited. A UK Met Office source gives 20 knots and 300m (1000ft) vertical barrier height as the minimum conditions for trapped waves n2 ibid. A striking satellite photograph in ref.113 shows a stratus sheet rippled by orographic turbulence extending hundreds of km in the lee of all but one of the South Sandwich Islands, a chain of mountainous volcanic islands in the S Atlantic. The responsible mountain heights here are between 1800 and 3600 ft. No effect is detectable from the lower island of Leskov (625ft, 190m).. A study in New Zealand indicated that winds in excess of 20-25 knots were required blowing at <30deg to the line of the orographic barrier, and found wavelengths of 4 - 20km with an average of 15km n3Alistair Reid, Mountain Waves & Clouds: Investigating the occurrence of cloud-producing mountain waves. www.physics.usyd.edu.au/pdfs/current/2002projects/Reid_MountainWavesClouds.ppt. Similar studies in the Sierra Nevada, California, have found wavelengths in the range 4 - 32km, with an average of 10-15km n4Vanda Grubisic and Brian J. Billings, Climatology of the Sierra Nevada Mountain Wave Events, Desert Research Institute, Reno, Nevada, Revised manuscript submitted to the Monthly Weather Review April 5, 2007 www.eol.ucar.edu/projects/trex/publications/papers/wave070405revised.pdf. The American Meteorological Society glossary also gives 5 - 35km as the range of wavelengths for trapped lee waves in the lower troposphere (1-5km altitude) n5 https://amsglossary.allenpress.com/glossary/search?.
The Lifted Condensation level, H, is the height at which an air parcel of a given constant moisture and heat content will become saturated due to adiabatic expansion-cooling when mechanically lifted. The formula n6 Petterssen, S., Introduction to Meteorology, McGraw-Hill, 1958 p.83. is
| 0.83 | T - Td | ||
|
|
°C | = |
|
| 100 m | H |
where T and Td are respectively temperature and dewpoint. Or approximately
H(m) = 120 (T
- Td)
which for Guernsey surface readings taken at 1350 and 1420Z (Appendix C, Table 2 ) gives H = 720m (~2400ft) and 960m (3150ft). Thus roughly speaking one would expect any orographic uplift cloud to condense at about 3000ft at the sighting time, about twice the altitude visually estimated independently by two pilots, but an order-of-magnitude match is probably good enough given that this is a rule of thumb and the true sea-level humidity is uncertain.
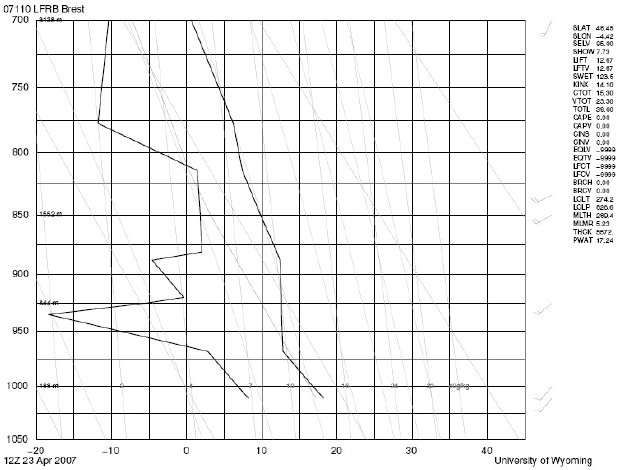
Unusual lenticularis was an early candidate for our UAPs. In the present case there is no high mountain barrier - barely even 1/3 of the minimum 300m cited - or strong wind. However the island of Guernsey does constitute a modest barrier (about 100m, 330ft at the highest southern point) to a SSW sea level breeze, and the triangulated UAP positions (see Fig.7) do fall in the lee of the island. Jersey meteorologist Frank LeBlancq pointed out n7 Email to Tim Lillington and Martin Shough from Frank LeBlancq 27.07.2007 that the presence of a temperature inversion (see Section 5) indicates a layer of statically stable air - one known precondition - and speculated that lenticular cloud might form in stratocumulus even at low level. On the other hand we also sought the opinion of Robin Hogan, a cloud physicist at Reading University. Based on information supplied including the Brest balloon ascent readings (Fig.34), satellite images and local weather observations it was Dr Hogan's opinion that lenticular development was "very unlikely" n8 Emails to Martin Shough from Robin Hogan, 28.08.07.
The surface breeze measured on Guernsey from 1350-1420 was only 6-7 knots, or about ¼ of the typical minima measured in mountain wave studies. The barrier height is not great, and the barrier profile - an abrupt windward side sloping very gradually to sea level on the leeward side - is the exact opposite of the optimum shape. There is reasonable doubt that a wave having an amplitude in the order of 10 times the barrier height (to reach the condensation level) could be kicked off in these conditions.
(courtesy Dept Atmospheric Science, University of Wyoming College of Engineering)
But it seemed somewhat plausible to us that the distributions of the causal variables must have a tail end, and that in the right conditions of atmospheric stability and humidity even a modest cliff and a slight breeze might sometimes generate a short-duration, possibly poorly-developed fragment of lenticularis. After all, might this not explain why the clouds were so small (angular size >1deg at 12nmi, or 22km, indicating diameter in the region of ~400m) compared with the diameters of typical lenticularis, and with the bulk of the parcel of air potentially lifted by a generally flattish island the size of Guernsey (63 km2, 24.3mi2)? Unfortunately the theory falls foul of problems with wavelength, amplitude and lenticular definition.
Firstly we found that the particular importance of wind speed is as the main factor in determining the wavelength of the orographic wave. The values are directly proportional n9 https://www.caem.wmo.int/_pdf/turbulence/OrographicTurbulence.pdf. For a given atmospheric stability, the higher the wind speed the longer the wavelength. It is the wave amplitude that is governed principally by the topography. The triangulated UAP positions in Fig.7 are approximately 18 and 36km from the south coast of Guernsey. It is striking that these distances could be consistent with lenticularis in the first two peaks of a mountain wave having a wavelength of approximately 18 km. But satellite measurements have shown that a 15km wavelength equates to a 30m/sec wind n10Reid, Alistair, op. cit., or approximately 60 knots, which is violent storm force (Beaufort #11). One would reasonably expect that light winds, and a low orographic barrier of only a few hundred feet, would produce not only small amplitude waves but, in particular, wavelengths at the low end of the ranges recorded, i.e., perhaps a few kilometres. The wind speed measured by an anemometer at the hypothetical uplift location (Guernsey Airport, not far from the cliffs at the south of the island) was a slight breeze (Beaufort #2), only about 1/10 of the speed that typically produces 15km wavelengths in the cited studies. Therefore an 18km wavelength in this case seems implausible.
Secondly, the very compact shape and "sharply defined edge" of the UAPs is a problem. The lenticular definition, we learned, is proportional to the wave amplitude. Generally, for a given wind speed, the wave amplitude is proportional to the size of the barrier, so at first sight it seems that in this case, with a very modest barrier, a large amplitude and well-defined lens clouds would not be expected.
A possible escape from this conclusion offers itself when we find that the degree of stability of the air layer is also a factor: A shallow layer of exceptional stability can produce higher amplitude waves than can a deep layer of only moderate stability. (This, in general, is why trapped lee waves produce well-defined lenticularis and untrapped lee waves do not.) So can we posit an extremely stable trapped layer?
Direct meteorological evidence is inconclusive n11 The noon radiosonde ascent at Brest on the SW of Brittany (Fig.35 and Appendix C ) shows an unstable layer below about 500m indicated by a decreasing Theta (potential temperature). Here, the atmosphere could not support gravity waves below about 500m, and it was far too dry for cloud condensation below about 1500m (email to Martin Shough from Dr. Robin Hogan, 28.08.07). No capping inversion is indicated, although there is a near-isothermal layer from ~500-1200m. But the profile is stable everywhere above 500m (indicated by a high positive Lifted Index of 12.67), suggesting that lee waves at the top of the unstable layer would not be vertically trapped and signature lenticularis would be unlikely. The meteorological model in Section 5 shows a strong inversion near the N Breton coast, with these highly stable conditions probably decaying over the sea south of the Channel Islands with a much weaker inversion here indicating decreasing stability. To the north, the noon ascents at both Camborne and Herstmonceux showed an unstable surface layer only about 200m deep, but a lower positive Lifted Index indicating overlying air still on the stable side although somewhat less stable than at Brest. . However it happens that the stability of the wave layer is in turn inversely proportional to the wavelength n12 https://www.caem.wmo.int/_pdf/turbulence/OrographicTurbulence.pdf , so exceptional stability would dictate short wavelength, and this is in tension with evidence for what appears to be a problematically long wavelength. The wave cloud theory therefore appears not to be internally consistent.
Another factor is that orographic waves can propagate many tens of kilometres and are in general associated with downstream turbulence and pressure fluctuations of concern to pilots. Up- and down-draft rates of hundreds of feet per minute occur in well-developed mountain waves, and rotor or roll clouds n13Rotors are vortex clouds that generally form nearer the ground underneath the lenticular clouds, often at the base of a stack (see Fig.31 and below) in the vicinity of lenticularis are associated with especially dangerous turbulence with up to ten times these rates. In our earliest interview we asked Capt Bowyer to describe the conditions of the flight, which brought the Trislander in downwind of Guernsey in a near-direct line with the hypothetical direction of orographic wave propagation. In fact it happens that when passing through the apparent ~2000ft altitude of the UAPs the aircraft was (hypothetically) itself almost exactly one 18km wavelength downwind from the triangulated position of UAP#1. But flying conditions were "standard", Capt Bowyer reported; it was a "normal day". Did he experience any turbulence during the approach, or in the descent to Alderney? "None at all." (See Appendix B)
The only instrument evidence we could find relating to local pressure variations was the regular surface observations made by Guernsey and Alderney Airport Met Offices. Guernsey's high ground is at the S end of the island, and it is here that SSW winds generating wave clouds would be obstructed by coastal cliffs. The expected result would be to build high pressure at the southern edge of the island where Guernsey Airport is located. The orographic wave would then induce alternating high and low pressure in the lee of the island, extending towards Alderney. Raised pressure would tend to accompany adiabatic compression in the troughs, and lowered pressure might be found below the peaks owing to adiabatic expansion-lifting of the overlying air. The 18km wavelength indicated by the triangulated UAP locations would lead to a wave peak close to the range of Alderney, where a low pressure reading might be expected.
The pressure figures read at Guernsey at 1350Z, 23 April 2007, were obtained thanks to the airport Senior Meteorological Officer, Tim Lillington n14 Email to Martin Shough from Tim Lillington, 07.08.07 At the altitude of the airport (336ft MSL) the reading was 1009.1 mbar. Sea level adjusted (QFF) pressure was 1021.4mbs. With appropriate adjustment this could be compared with the 1350Z Alderney QNH surface pressure reading recorded in the CAA report (Appendix A).
Sea level pressure QFF at Guernsey, 1021.4 mbar, is a shade higher (+0.4 mbar) than the QNH sea level pressure at Alderney. QNH pressure at Alderney was 1021 mbar, which is adjusted from the ground level reading by assuming the International Standard Atmosphere (ISA) pressure lapse rate of 27 ft/mbar, whereas QFF pressure at Guernsey (1021.4) is adjusted by using measured temperature. So if the actual pressure lapse rate exceeds ISA then QNH will underestimate sea level pressure relative to QFF; conversely, if the lapse rate is less than ISA it will overestimate it. In this case 336/(1021.4 - 1009.1 mbar) = 27.3 ft/mbar. So the true lapse rate here is very slightly greater than ISA and QNH will very slightly underestimate the pressure, probably accounting for the very small 0.4 mbar differential between QNH and QFF in a flat pressure field containing Guernsey and Alderney. We can interpret this to mean that there is no evidence of the pressure gradient between high pressure at the S end of Guernsey and low pressure at Alderney that would be expected to be associated with an orographic wave of the wavelength indicated.
Capt Bowyer remarked to us that he has seen lenticularis many times when flying many routes and insists that he would not have been deceived by a lenticular cloud. With the benefit of 12 minutes observation both with naked eye and 10x binoculars he described both objects as appearing to be "very sharply defined", and so bright as to appear self-luminous. A second witness described "very bright" white-yellow light as bright as a specular reflection of sunlight - "like the sun reflecting off glass". Another witness judged that the light was "brilliant . . . A lot brighter than a reflection of the sun would create." These estimates of brightness are not at all suggestive of daylight scattered by any ordinary cloud.
We might be able to rescue the theory by assuming some unusual coronal effect. Coronas and iridescence have been seen in mountain clouds, an effect (sometimes called irisation) which could be relevant to perceived colour and brightness. Such coronas are explained as diffraction by water droplets (or small ice particles, but not in this instance) and so imply illumination from behind the cloud at a small angle to the line of sight.
A bright corona would need illumination approaching zero degrees. In the present case a cloud would be directly illuminated at 45° to the line of sight. True, the limiting angle of diffraction is inversely proportional to droplet size, so a fine mist can diffract incident light through a larger angle than can large droplets; but unfortunately the brightness efficiency has an exactly opposite dependency, i.e., the intensity of the diffracted light is proportionately weaker, and the forward scattered intensity at such a large angle would be negligible. Coronal diffraction in cloud is normally only seen at all at scattering angles <40° And it does not seem that this could explain the reported yellow colouration anyway, since the dominant colours of wave cloud coronae are red and blue. Some observers have reported red and green, but not yellow n15 J. A. Shaw and P. J. Neiman, Coronas and iridescence in mountain wave clouds," Appl. Opt. 42, 476-485 (2003) https://www.opticsinfobase.org/abstract.cfm?URI=ao-42-3-476.
Generally the iridescence seen in these coronae occurs in the region of low droplet density at the cloud edge rather than across the denser opaque body of the cloud. Our UAPs appeared uniformly bright (apart from the vertical "graphite grey" bands on each). One could try to speculate that in the present case a less well-developed lenticular cloud has a lower density overall, and is more like a translucent mist. But this seems in tension with the excellent lenticular definition required to explain the observed "sharply defined" edges n16 Given such a mist it is conceivable that a specular glint reflection from a distant sun-glitter pattern on the sea (for example) might work as a secondary source of diffraction close to the line of sight. Such a scenario is discussed in Section 6d..
With regard to shape and definition we should note that rotor or roll clouds are, as mentioned, turbulent vortex clouds occurring in parts of the mountain wave below the level of lenticular clouds. They are sometimes described as columnar "cumulus bar" clouds (or in higher/colder conditions than obtain in the present case they may occur as semi-transparent cylinders of thin cirrus sheets). They can have fairly well-defined edges, like their lenticularis cousins, and form with the horizontal roll axis lying perpendicular to the airflow n17 Ozawa, H., K. Goto-Azuma, K. Iwanami, and R.M. Koerner, 1998: Cirriform Rotor Cloud Observed on a Canadian Arctic Ice Cap. Mon. Wea. Rev., 126, 1741-1745. https://ams.allenpress.com/perlserv/?request=getdocument&issn=1520-0493&volume=126&issue=06&page=1741#i1520-0493-126-6-1741-corby1. Some similarity can be argued between the typically cylindrical form of roll clouds and the UAPs in this case. But similar problems arise.
Would a series of unusually well-developed ("sharply defined") rotor clouds occur in isolation from their usual lenticular partners? These are the most energetic of mountain wave features, and seem rather less likely to occur given light winds and a very modest orographic barrier. Moreover the same red-blue-green coloration is likely to be observed in rotor cloud coronae n18 Ibid., although it is true that because they are usually associated with a turbulent layer extending to the ground in the lee of the barrier, they can often pick up dust particles and other debris, which might affect the diffraction properties of the cloud edges (but would tend to increase the optical thickness, further reducing any translucency in the body of the cloud).
Howsoever no turbulent, low-level winds were recorded by met observers on Guernsey, or on Alderney although the latter lies close to where turbulence (or even a reversed surface wind direction) might indicate the rotor circulation under the second lee-wave peak (UAP#1). Neither were rotor clouds (or indeed any low clouds at all) recorded at either station. Guernsey's Senior Meteorological Officer Tim Lillington confirmed to us that only "normal" altocumulus at 12,000ft was being observed n19"Alderney airport observers would not have made the distinction [between standard and lenticular altocumulus] as they are not obliged to be that specific." (Email to Martin Shough from Tim Lillington ) Nevertheless they, like Guernsey, reported no low level cloud at all.. And of course the 18km wavelength consistent with the triangulated UAP positions remains anomalous in terms of the wind speed.
We have searched satellite images in the visible and IR without seeing any persistent large phenomena in the area indicated. Although the best resolution (250m) is not available nearer than about 40 minutes before the start of the sighting, and there is then a broken veil of intervening high cirrus, no prominent compact clouds are discernable in the area. We found a rather bright cloud spot a few miles east of Guernsey on a Meteosat 8 visible light image timed at 1415Z and took note of an opinion given to us by Meteo-France (Centre de Météorologie Spatiale) that this could be "an orographic cloud development" n20Email from Pierre Blouch, Meteo-France, Brest, to Jean-Francois Baure, 12.07.2007. However we were able to discount this possibility.
Viewing successive images in a slideshow discloses that the cloud feature is actually developing before it reaches Guernsey (see Fig. 36), and moreover infra red cloud top data indicate that this is at about 15,000 ft, which appears to be confirmed by the fact that instead of following low level winds of a few knots it is moving rapidly from W to the E of Guernsey at about 35 knots (consistent with the UK Met Office Form 214 upper air forecast for 50°N 02°30'W, and the Jersey Airport local area aviation forecast, both of which show winds swinging 230-260° through this altitude).

Whatever its origin this cloud was also far too high above the observers' near-horizontal or even depressed lines of sight to the UAPs. It was also moving in the wrong direction (W to E at ~0.75°/min) across the line of sight from the Trislander, which LOS rotates in the opposite sense (E to W) at about the same rate during the observation.
In conclusion, the lenticular cloud theory seemed initially promising, but we are disappointed by it. It is true that certain factors would be easier to explain if we could place some such phenomenon at the location. For example, colouration, absolute brightness, and other factors aside, the relative brightnesses of the of objects as seen looking towards the sun from the NNE and away from the sun from the south ("brilliant yellow" and merely "yellow/beige" respectively) might be qualitatively consistent with the forward-scattering and back-scattering respectively off the top of a sunlit surface like a bright cloud. But there are a number of meteorological and other problems. Also let's recall that there were two of these "clouds" each with identical dark stripes 2/3 of the way along their length. We have considered the possibility of jet contrail or cloud shadow(s) lying across them. But it would be asking a great deal for the same contrail shadow to do the same trick on two small clouds 18 km (about 10nmi) apart.
Plausibility: (0-5) 2