The Jersey weather radar was of interest for two reasons. Unlike the ATC radar data, which is specially processed to remove non-aircraft targets, weather radars collect essentially unprocessed raw radar echo n1Some limited signal processing may be done and this was investigated by enquiries to Jersey Met Office and from internal evidence (see Appendix ). But it is in any case limited to possible subtraction of permanent ground clutter by means of a clutter map and/or insertion of data from higher-level cuts into these areas. This does not affect coverage of targets in areas free from permanent ground clutter, i.e., over the open sea.. This enhanced the possibility of finding echo correlating with any stationary radar-reflective phenomena. Additionally, the weather radar images could contain information on likely radar propagation conditions at the time (see Appendix D). We hoped that this information might help to calibrate conclusions reached about the temperature and humidity profiles of the atmosphere from indirect meteorological evidence. This in turn might help to improve our confidence in the likely optical refractive index values (see Section 5, Meteorological Conditions in Sighting Area).
Operated by Jersey Meteorological Office and located in the SW of the island near the airport, this is a C-band weather radar employing a 5 minute scan algorithm. An approximately 1° pencil beam rotates at approximately 1.1 rpm and changes elevation incrementally so that it sweeps out the total surveillance volume in a series of four separate slices or cuts (called beam 0, beam 1, beam 2 and beam 3) followed by a short period of idle time during which software constructs a synthetic image (known as beam-S) from the four real images before the cycle starts again.
Weather radar scans timed at 1400, 1415 and 1430Z, 23 April 2007 were obtained in BUFR file format thanks to the assistance of Tony Pallot, Principle Meteorological Officer, Jersey Airport Met Office n2The authors also acknowledge the assistance of Dr. Miguel Rico-Ramirez of Bristol University in sharing software files necessary for visualising the radar data. The basic product of each scan is a set of four images from the four elevation cuts having a horizontal resolution of 2km. The antenna boresight elevations are:
Beam 0 = 0.5°,
Beam 1 = 1.0°,
Beam 2 = 1.5°,
Beam 3 = 2.5°.
Beam-S produces a cleaned synthetic image by inserting higher elevation data into the beam-0 image according to a map of permanent clutter areas.
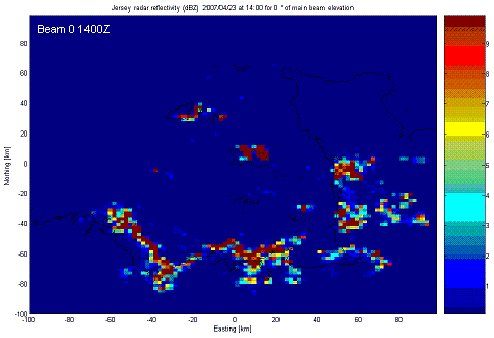
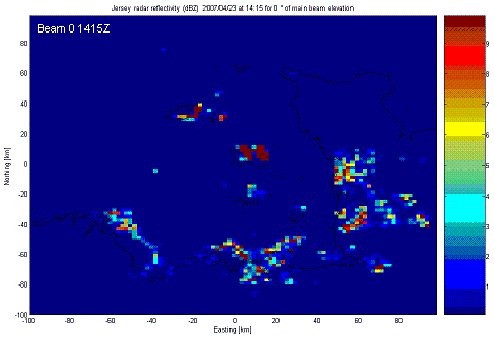
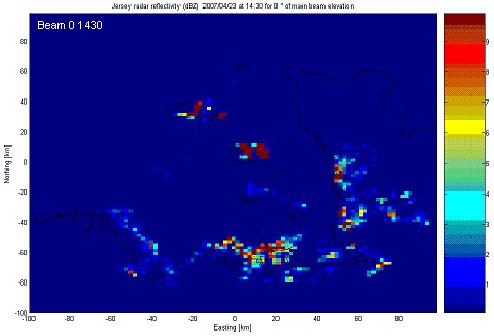
The three raw 0.5° (beam 0) images are shown in Figs. 15, 16 & 17. The coloured bars on the right are scales showing different levels of reflectivity in dBZ n3 Z is reflectivity. The difference between any two colour bands is a constant logarithmic ratio of received power measured in decibels. It was established that the times given are in fact the start times of the beam-0 cut in each case (although this is not actually the first in the sequence) so that the beam-0 image from the 1415 scan in Fig 16 shows us the 0.5° rotation from about 1415-1416Z. This 60-second scan is therefore the only available weather radar cover at the relevant altitude during the known visual sighting period.
The poor pixel resolution is obvious at a glance, as is an apparent displacement and/or scale mismatch between the echo video and the map overlay n4A similar mismatch was found to have been noted in published meteorological research work using this radar. See Appendix D, making it difficult to judge echo location reliably from this image. The resolution cell has effectively the 2km x 2km range and azimuth dimensions of the display pixel (coarser than the true electromagnetic resolution), and assuming a depth of 1° the cell volume is about 4 km3 at a distance of 50km, including the ocean surface and the atmosphere up to about 3000ft altitude.
A few pixels south and north of Guernsey contain very weak reflectivity which could be approximately in the line of sight from the Trislander, and there is a weak signal intensity in one pixel whose correct location might arguably be a few nautical miles south of the Casquets in the area of the Casquet Banks, which is near the rough triangulated position of UAP #1.
The Jersey Met Office shipping forecast for the area limited on the west by the 3°W line of longitude (about 25nmi west of Guernsey), valid for the 24 hours starting at noon on April 23 (about 2 hours before the start of the sighting) mentioned the possibility of occasional rain spreading in from the west, but no weather reports indicate precipitation in the Guernsey- Alderney area at the sighting time.
As for low altitude aircraft: The Blue Islands Jetstream would have been passing through FL30 sometime during the 1415 beam-0 cut, but it was nearly 20nmi away at that time; and the FlyBe BAe146 (Jersey 912G) would have been quite nearby (see Fig.6, Section 2) but reportedly above 6000ft and therefore too high to be detected. It is clear from Channel Islands Zone radio communications (Section 2) and the report of the Controller (Appendix A) that ATC was tracking no other candidate aircraft at this time.
However a Brittany Ferries vessel is expected in the area (though not very near the shallows of the banks of course n5Paul Kelly speculated that the "possible anaprop" echo he observed in the area could have been "waves on the reef at the casquets". The Casquet banks area is to the south of the islet where Casquets Lighthouse is situated. Marine charts show the mean sea level depth over the banks reducing to as little as 3m. At the sighting time the tide was only about 2/3 of the way through its 6-hour ebb cycle. The next low tide (3.3m above chart datum, chart datum being the lowest possible astronomical tide) was at 1649Z, the previous high tide (7.4m above CD) having been at 1034Z. Thus the low tide would be about 2m below the mean tide. Assuming the mean tide on the day to be close to chart MSL then at low tide, 1649Z, the shallowest spot on the banks would still be a metre or so below the average wave height. More than 2½ hours earlier at ~1412Z, with slight sea conditions in a light breeze, there may be some doubt as to whether wave disturbance would have been significant). It was probably detected by the Guernsey primary surveillance radar as Track B in Fig 12 and might also have been picked up by the Jersey weather radar in conditions of mild super-refractivity (see Section 5).
Also, it should be remembered that the weather radar reflectivity represents the aggregate echo received from the whole 4 km3 resolution cell. There are various other possible reflectors inside this volume - wave slopes, rocks, seabirds, small fishing boats etc - that could be sources of transient weak echo.
So the weather radar picture doesn't allow us to say there was no radar reflector near the triangulated UAP#1 location, but it doesn't provide unambiguous evidence of an unexpected or unusual echo in the appropriate location. There also appears to be no trace of echo at the triangulated location of UAP#2. It may be reasonable to say that if there were UAPs with visual dimensions in the order of hundreds of metres (consistent with visual estimates of angular size) at these locations they probably had small radar cross-section at C-band.
In weighing this result we should bear in mind that the radar has the opportunity of only one very brief sampling. At 50km range a 2km resolution cell corresponds to ~2.5° = 1/(360/2.5 ) = 1/144 of the 60-second antenna rotation, or about 0.4sec, and the total dwell-time of a point target in the 1° beam width would be only ~1.7sec.