Vallée, Jacques : Journal of Scientific Exploration, vol. 12, n° 3,
 : Journal of Scientific Exploration, vol. 12, n° 3,
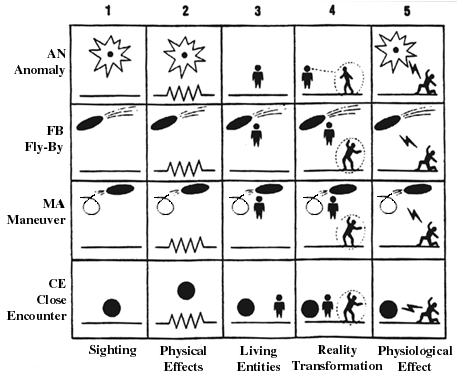
Dans un excellent catalogue compilé par M. Larry Hatch n1[Larry Hatch's computer catalogue is available from him in diskette format under the DOS operating system running on standard IBM-compatible PCs. His address is 142 Jeter street, Redwood City, California 96062] et made available to researchers and to the general public one finds 15 181 unexplained aerial phenomena reports that have been tabulated in computer-readable form. We have broken down these cases according to the classification system used by this author (Vallee, 1990) in order to bring out the distribution of incidents across various situations. Under this classification, inspired from Hyneks definition of close encounters (Hynek, 1972), each case is given a type and a category. Hynek used a single digit representing the "kind" or type of incident, ranging from "1" for a simple sighting and "2" for physical effects to "3" for report of a lifeform or living entity. We have extended this typology using "4" in cases when witnesses experienced a transformation of their sense of reality (often corresponding to the popular characterization of the incident as an "abduction) and "5" in cases of lasting physiological impact, such as serious injury or death.
The categories to which the typology is applied range from "CE" for close encounters and "MA" for maneuvers (trajectory discontinuity) to "FB" for fly-by (no observed discontinuity in flight) and "AN" for simple anomalies in which no UFO was reported: unusual lights or unexplained entities fall into this last category.
Using this classification we would speak of a particular case as a CE-3 incident, or a MA-2 incident, etc., leading to the simple matrix of Table 1, which provides a convenient way for establishing a baseline in comparing reports from various countries or from various epochs.
When the Hatch catalogue is mapped into this classification the resulting distribution is that of Table 2, showing 3175 cases of physical effects, or 21 % of the catalogue, broken down as follows: 90 are associated with simple anomalies, 19 with a fly-by, 1782 with maneuvers and 1284 with close encounters. It should be noted that we are using the January 1997 version of the Hatch catalogue, which is an evolving entity. Statistics performed on other versions may differ from those given here.
In Table 2, "physical effects" may refer to soil disturbances, broken tree limbs, crushed grass, burned areas, or to a variety of electromagnetic effects.
| Type | 1 | 2 | 3 | 4 | 5 | |||
|---|---|---|---|---|---|---|---|---|
| Catégorie | Observations | Effets physiques | Formes de vie | Transformations de la réalité | Effets physiologiques | |||
| AN | Anomalie | 323 | 90 | 103 | 78 | 56 | 650 | 4,3 % |
| FB | Fly-by | 3657 | 19 | 7 | 1 | 0 | 3684 | 24,3 % |
| MA | MAnœuvre | 4551 | 1782 | 139 | 412 | 89 | 6973 | 45,9 % |
| CE | Rencontre Rapprochée | 1158 | 1284 | 593 | 530 | 309 | 3874 | 25,5 % |
| 9689 | 3175 | 842 | 1021 | 454 | 15 181 | 100 % | ||
| 63,8 % | 20,9 % | 5,5 % | 6,7 % | 3,0 % | 100 % |