Introduction
Most of the thousands of existing reports of UFO phenomena are poor sources of information. They contain little or no data, are reports of hoaxes, or are the result of misidentification of familiar objects. Only a very small percentage of these reports provide concrete information from which any inferences can be drawn.
The need for instrumented observation of UFO phenomena arises from the fact that an observer's unaided senses are not reliable recorders of scientific data. Further, the ability of an observer to supply useful information is affected by his training, his state of mind at the time of the observation, and his suggestibility, both during and after the event. Accuracy requires instruments to measure precisely data such as angles, apparent or real velocities, distance, color, and luminance.
Even an observer with optimal training, objective state of mind, and minimal suggestibility is hard pressed when unassisted by instruments, to provide useful scientific information. This is especially true in the case of UFO phenomena, which are typically of short duration, occur in an unfamiliar environment, and lack points of reference from which reasonable inferences as to distance, size, and velocity can be drawn.
Even when instruments are available to him, the observer and the analyst of his report must be aware of a process inherent in any scientific inquiry; namely, the tendency of the investigator to look for evidence to support or discount a given hypothesis. In this state of mind, the investigator tends to disregard all data from his instruments that are irrelevant to his predetermined goal. An air traffic controller, for example, concentrates on radar echoes that he feels quite certain are those that come from those aircraft for which he is responsible. A meteorologist focuses his attention on quite different data on the radar scope: thunderstorm, tornado, and frontal activity. The military observer pays less heed to natural phenomena and concentrates on data on the scope that might signify the approach of ballistic or orbiting bodies.
In other words, almost all investigative processes begin with a built-in "filter" designed to minimize whatever, for the investigator concerned, constitutes "noise." But one man's noise is frequently another man's data. The physicist interested in the elastic scattering cross-section of pi-mesons interacting with protons begins his analysis by setting up criteria that tend to eliminate all inelastic events.
This filtering process turned out to be at work when researchers in atmospheric physics examined the read-out of a scanning photometer, an instrument normally used in studies of airglow. The device scans a sector of the sky and records the result as a trace on paper tape. The zodiacal light and the Milky Way appear as broad humps; stars and planets as sharp spikes. An UFO would also appear as such a spike, but its motion would cause the spike to appear in different parts of the sky in successive scans.
Would the operator of the scanner notice such a trace? Or would he ignore it, along with the star and planet "noise"? Since his attention is focussed on the traces that indicate airglow, it seemed likely that he would fail to notice any trace attributable to an UFO.
This proved to be the case. Examination by project investigators of a zodiacal light photometer read-out made at the time of a visual sighting revealed four spikes in successive scans that could not be attributed to stars or planets. The personnel analyzing the data had ignored them. Geometric reconstruction of the object's path established that the photometer had recorded a ballistic missile in trajectory over the Pacific Ocean. Details are found in Section 8 of this chapter, "Haleakala II."
But even if the operator of an instrument fails to notice what, to him, is noise, another operator employing the same device for a different purpose has access to all the recorded data md can therefore search for the specific information of interest to him. As demonstrated in the case of the scanning photometer, the instrument can be employed to provide a record of an UFO that can later be subjected to scientific analysis. Not all existing instruments, however, have adequate resolving power or other design features for effective searches for UFO phenomena.
Future studies of UFO phenomena should, in my judgment, be based upon information recorded by suitable instruments. This chapter will discuss existing instruments and instrument systems with special reference to their suitability for an UFO search. It will also suggest what instruments and instrument systems might be devised that would more readily yield suitable data for the study of UFO phenomena.
The All-Sky Camera
The all-sky camera was developed in order that permanent photographic records of the time of occurrence, intensity and location of auroral and airglow displays could be made automatically. During the International Geophysical Year, (1957-1958) 114 all-sky cameras were in operation at sites from near the North Pole to the South Pole.
The cameras are designed to photograph about 160° of the sky and to record angular distances from the zenith by means of lights. Photosensitive detectors switch the cameras on at dark and off at daylight. Exposures are short and can be set to any desired value. Local or Universal Time and length of exposure are recorded on each frame. Table I lists the salient points of the cameras of several participating countries. For further details see: Annals (1962) Gartlein (1947).
The film is examined by trained personnel and the data on auroral position and brightness in each of three areas, as a function of time, are entered on a five-line format called an "ascaplot." The three areas are the northern, zenith and southern. The northern and southern zones cover the regions lying between 600 and 800 from the zenith, and the zenith area takes in the whole of the sky between 600 and the zenith.
| Country | Film width mm. | Number of exposures per hour | Exposure in seconds | Film Type | Time Accuracy |
|---|---|---|---|---|---|
| USA | 16 | 60-80 alternating | 10-20, 15, 48 | Eastman Kodak Tri-x, Ilford HP-3 | ±10 sec. to ±2 minutes |
| Canada | 35 | 60 | 4-40 alternating | Eastman Kodak Tri-x Pan. | ±3 sec. à ±1 minute |
| Canada | 16 | 60 | 30 | Eastman Kodak Tri-x Neg. | ± 1 minute |
| URSS | 35 | 12, 60, 120, 180 alternant | 5, 10, 20 alternant | High sensitivity Negative Pan. | ± 2,5 s |
| Japon | 16 | 240 | 13 | High sensitivity Pan. | ± 0,3 minutes |
| Argentine | 16 | 60, 48 | 20 | Eastman Kodak Tri-x | ± 1 minutes |
At a height of 100 km.; the lowest altitude at which auroras generally exist, the camera covers a region of about 30 of latitude.
Most of the cameras record on 16 mm. film, and the diameter of the circular sky image is about 10 mm. Since the individual silver grains in the emulsion are of the order of 1µ (0.001 mm.) in diameter, an image less than 20µ is very poorly resolved. To produce a 20µ image, an object 100 km. distant would have to be no less than 600 meters in diameter. It is apparent that the resolution of such an instrument is not adequate for objects of more terrestrially common dimensions.
The sensitivity of the all-sky camera is also disappointingly low for purposes of UFO search. For instance, referring to point sources, Dr. Gerald M. Rothberg, in his report on one month's observation with one of these cameras, states that five miles is "roughly the maximum distance at which we can detect the landing lights on commercial airliners, as determined from photographs of planes ..."
The sky-coverage of these instruments is very good, however, amounting to about 83% of a hemisphere of the same radius. However, each camera can sample only about 0.2% of the volume of sky 100 km. high over the continental United States, which amounts to about 9x10⁸ km3.
A thorough test of a 16 mm, U.S. all-sky camera was made by Dr. Rothberg during August 1967. (Case 27) The camera was operated for about 150 hours on seventeen nights. Exposures started at dusk and ended at dawn. The camera made one 40-sec. exposure per minute. The total number of frames taken was about 9,000 during a period when 106 local UFO sightings were reported. Rothberg states that
... continued at high frequency during the feasibility study, less than 12 of 9,00U all-sky camera exposures contained images not immediately identifiable. Only two of these coincided in time and azimuth with a sighting report. Study of one negative suggests that the image is either that of a meteor whose path was at or nearly at a right angle to the focal plane or that an emulsion defect or impurity is responsible for the image. The other negative's image was identified as a probable aircraft. (Case 27).
One UFO sighting was definitely recorded by the camera; the objects were three garment-bag balloons which were photographed repeatedly over a period of 15 min.
In appraising the value of the all-sky camera as the instrument to use in any follow-up investigations, Dr. Rothberg is "less than enthusiastic about (their) use" for an UFO search.
Put very simply, a camera designed for the observation of airglow and auroral phenomena, both of which are large, amorphous luminous regions, does not have the resolution necessary for investigating phenomena such as fireballs, ball lightning, tornadoes, or UFOs.
The Prairie Network
Evaluation of the Prairie Network
The Tombaugh Survey
Photomètres scrutateurs
La photométrie du ciel nocturne est menée au moyen de photomultiplicateurs which sweep out circles parallel to the horizon (almucantars) at various zenith angles Z (Z = 90 ° - altitude). Photometers used in airglow studies have a 5° field and sweep at the rate of 10°/sec horizontally and 5°/sec vertically. A "sky survey" consists in making 360° sweeps at each of six zenith angles as follows: scanning clockwise at Z = 80° at the rate of 10°/sec, counter-clockwise at Z = 75° at 5°/sec and repeating the process at the same rate at Z = 7° 60°, 40°, and 0°. A survey requires 4.1 min. Often a series of surveys is made using different filters depending on the nature of the investigation.
The output of the instrument consists of pulses, the amplitude of which is proportional to the intensity of the light sensed by the photometer. In older models the output is recorded analogically by a pen on paper tape. Since the distance along the length ("x" axis) of the tape is proportional to the time of the scan, it is therefore an indicator of the azimuth and zenith angle of the light source represented by the pulse. Data are analyzed by measuring the height of pulses of interest ("y" axis) and determining their azimuth at each zenith angle. This measurement is done manually or in the new model, by recording the coordinates directly on machine-readable magnetic tape.
The angular size of the field, sweep rate, and other quantities differ depending on the use to which the instrument will be put. A zodiacal light photometer, for example, has a narrower field, 3°, scans at about 2°/sec and sweeps out almucantars at much smaller zenith distances, that is at altitudes much closer to the zenith.
Bodies brighter than MV = +3 can readily be identified by their angular coordinates coupled with pulse height which is a measure of their magnitude. In practice, however, identification is rarely carried out because investigators of airglow and zodiacal light are interested in diffuse light phenomena rather than in single bright objects.
The sky coverage of the photometers is large since they can be made to scan an entire hemisphere as in the case of the all-sky cameras. The fact that they do not do so in the same short period of time as the cameras is not very important since at large distances the linear sweep speed approaches the velocity of light. Because their observations are made over a longer period of time and their angular data is recorded over a very much larger area, they have a greater resolution; azimuth and altitude are presented more accurately and the direction of motion is non-ambiguous.
Colorado project scientists thoroughly searched two such photometer sky surveys. The first search was made on an airglow survey chosen at random and the results are summarized in section 7 of this chapter. The second search was prompted by a visual sighting by three trained persons of a bright object in retrograde (E à O) motion during the operation of a zodiacal light photometer.
Scanning photometers can also sense different colors on separate surveys. The instrument's ability to measure the degree and direction of polarization can also aid in determining whether the object is self-luminous or its light is reflected. For these reasons, and because of their relatively extensive sky coverage, scanning photometers can be considered useful instruments in the conduct of UFO searches.
Haleakala I
Une recherche fut effectuée sur la sortie sur bande de l'étude photomètre airglow enregistrée vers minuit, Heure Standard Hawaïenne (HST), afin de voir si tous les objets lumineux pouvaient être identifiés en tant qu'étoiles ou planètes. Cette étude fut choisie au hasard depuis un échantillon d'études effectuées dans des conditions particulièrement bonnes, c'est-à-dire, lors de nuits during the dark of the moon avec le minimum d'interférence dues aux nuages. Les données sur bande, consistant en la luminosité en fonction de l'azimut, was plotted by machine in two ways, the first showing the raw data which included light from all sources, and the second, the raw data from which the background of zodiacal light, Milky Way and integrated starlight had been subtracted. On both plots, individual stars and planets stand out as narrow pulses, their height being proportional to their apparent magnitudes. The brightness is measured in terms of the number of 10th visual magnitude stars per square degree of sky, that is, in "S[10](vis)" units.
The observations of that night were made through three filters successively: 6300 ± 5 Å, 5577 ± 5 Å and 5300 ± 25 Å. As each survey through each filter requires about four minutes, successive sweeps at the same zenith distance through the same filter occur at ~15 min. intervals, and one sweep at, say Z = 80°, will be followed by a sweep at Z = 75° about 36 seconds later and repeated at the same altitude about 15.5 min. later.
No stars or planets showed up in the surveys through the 6300 Å and 5577 Å filters, but probably because of its broader band-pass, many more appeared when the 5300 Å filter was used. In this survey, all star pulses greater than MV = +3 were accounted for by reference to a star atlas, except for two. These have been designated as Unidentified Bright Objects (UBO), having the coordinates given (see Figs. 3 and 4) below (see also Figs. 5 and 9 [5 & 6]).
| Angle Z | HST | Azimut |
|---|---|---|
| 80° | 23 h 50 | 68°T |
| 75° | 00 h 05 | 72°T |
The pulses were separated by 4° in azimuth and 5° in altitude. The azimuthal error in this photometer can be as great as ± 4°. Since the field is 5° and the point source can be sensed equally well over almost the entire width of the field, the altitude uncertainty may be ± 5°
From the recorded values of the angles, if the two pulses were made by one body, it moved an angular distance of
If the errors are in phase, then, maximally:

and minimally

Le fait que l'UBO soit apparu en seulement 2 sweeps sur de nombreuses études pourrait être interpreté comme signifiant qu'il avait disparu dans l'ombre de la Terre à z = 75°. Cette situation est montrée en 2 dimensions dans les figures 5 et 9 [3 & 4].
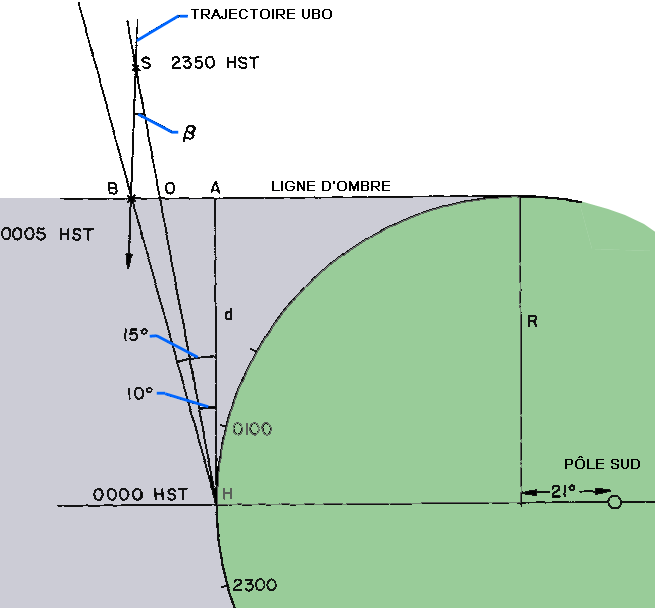
Dans la figure 5, qui est une vue de la Terre, regardant vers l'hémisphère sud, Haleakala (21° N) réside sur la ligne Terre-Soleil à 24 h 00 HST et le bord de l'ombre de la Terre y est parallèle. Dans la 1ʳᵉ approximation, la distance d de Haleakala à la ligne d'ombre est :
d ~ R = 6371 kmet
OH = d/cos 10° = 6469 km.Les distances nominale, maximum et minimum parcourues par l'objet sont :
OBnom = 6469 x 0.1134 = 734 km.
OBmax = 6469 x 0.2240 = 1449 km.
OBmin = 0 km.
En 15 mn, pour une vitesse de :
Vnom = 48.9 km/mm nom
Vmax = 96.6 km/mm max
Vmin = 0km/mm
Ces vitesses devraient être comparées à celles de l'UBO à Haleakala II, c'est-à-dire, ~142 mi/mn = ~228 km/mn. Si l'UBO était en orbite, la distance GB est la projection de sa trajectoire SB faisant un angle Beta avec la ligne de visée. En considérant que la vitesse à Haleakala II est typique, alors :
et l'objet était dans une orbite hautement elliptique. Alternativement, la distance OB pourrait avoir été la projection de l'apogée de la trajectoire balistique d'un corps lancé dans une direction rétrograde.
L'enquête a montré qu'aucun missile suborbital ne fut lancé depuis la base aérienne de Vandenberg ou de Pt. Mugu avant 1 h ou plus après cette observation. Le Bureau des Phénomènes Aériens à la base aérienne de Wright-Patterson suggère qu'il aurait s'agir d'un satellite artificiel sur lequel des informations ne sont pas facilement accessibles. L'objet est ainsi dans la catégorie des non identifiés.
Haleakala II
Les 3 observateurs à l'Observatoire Haleakala qui opéraient 2 photomètres scrutateurs virent un objet brillant se déplacer du NE à l'O à basse élévation. Les sorties sur bande papier de chaque instrument furent examinées ; le photomètre airglow opérait avec des filtres rouges et d'enregistra rien qui stood out against the background, but the zodiacal light photometer detected the object four times through a 5080 ± 30 Å filter. Other prominent astronomical features, such as Eta Canis Majoris, labelled nCMa, were readily identified. The characteristics and operation of this photometer are somewhat different from the one used in airglow measurements. Its field is 3°; its sweep rate is 2°/sec; and almucantar increments are 1°. Because the focus of attention is the brightness of the zodiacal light a few degrees on each side of the plane of the ecliptic, the sweep was restricted to 160° starting from 0°T, each sweep being completed in 80 s.
The survey in which the UBO appeared began at 0419 HST and ended at 0451 HST, on 11 September. The tape record is reproduced in Fig. 8 [Fig 1] and the data summarized in Table 3.
The object was identified as OP 8038, a sub-orbital missile, which lifted off Vandenberg AFB at 0425 HST. The great circle distance, d, between launch and observation points, is calculated from the rough coordinates:
| Latitude | Longitude | |
|---|---|---|
| Vandenberg | 34,5° N | 120,7° O |
| Haleakala | 21,0° N | 156,0° O |
and it is found that
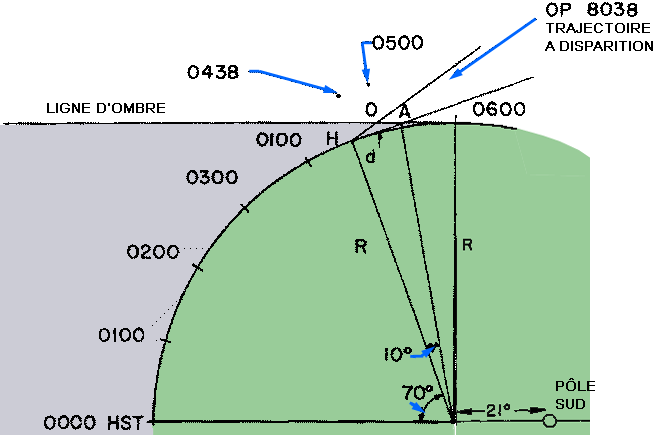
d = 3762 km.The position of Haleakala with respect to the shadow-line of the earth is shown in Fig. 6 [Fig 5], which is a view of the earth with the southern hemisphere toward the reader. On 11 September the sun rose at 0618.
| Observation | HST | Elévation | Azimut (Psi) | t (min.) | Delta Psi | ||
|---|---|---|---|---|---|---|---|
| h | m | s | |||||
| 1st | 04 | 34 | 25 | 14° | 47° | --- | --- |
| 2nd | 04 | 35 | 28 | 15° | 41° | 1.05 | 6° |
| 3rd | 04 | 37 | 45 | 16° | 36° | 2.28 | 5° |
| 4th | 04 | 38 | 37 | 17° | 37° | 0.87 | -1° |
At 0439 HST the point of observation, H, was 70° east of its position at midnight. The distance to the point where the body was last seen is HO which, from known quantities is
HO = 638 km,and that by the time the object vanished, it had travelled a great circle distance
d' ~ 3100 kmin 13 m 37 s for an average velocity over thee earth's surface of
V ~ 228 km/min.
The distance, d, of the body from the observer at each sighting until its disappearance, which is assumed to be coincident with the time of last observation, is shown in Fig. 7 [Fig 6]. From the angular velocity, the angle of approach, Beta, can be approximately computed; the relevant quantities are listed in Table 4, where Omega°, Omegar is the angular displacement in degrees and radians, respectively, Phi is the projected displacement in kilometers and Vav the average velocity between each observing interval, in km/min. The measure of ellipticity is, as before, Sin Beta = V/228, where Beta is the angle between the trajectory and the line of sight.
The data were obtained directly from the output tape, eliminating almost completely errors due to manual data reduction. Backlash errors in azimuth are negligible. As a field is only 3°, the uncertainty in altitude is smaller than with a larger field, and remains ±1.5°, the error in Phi for the first interval ~5%, for the second ~10% and very high for the third. However, it must be emphasized that the geometrical reconstruction was quite crude and errors introduced by it are probably greater than instrumental errors. Absence of information about the trajectory introduces the most serious uncertainty and the values for d, Phi, Vav and Beta should be regarded skeptically. The errors shown in Table 4 are derived entirely from the uncertainty in the field.
| Sighting Interval | Omega° | Omegar | d | Phi | Vav | Sin Beta | ~Beta | ||||||
|---|---|---|---|---|---|---|---|---|---|---|---|---|---|
| 1-2 |
|
|
1595 | 172 | 164 | 0.72 | 46° | ||||||
| 2-3 |
|
|
1356 | 121 | 53 | 0.23 | 13° | ||||||
| 3-4 |
|
|
836 | 19 | 22 | 0.10 | 6° |
Even though the reconstruction is very approximate, the magnitude of Beta indicates a sub-orbital trajectory, because when last seen the body was
| h ~ 638 sin 17° + |
6382
8 x 6371 |
~ 194 km. |
above the surface of the earth, and at this distance it would be expected that Beta = ~17° for an object in orbit.
Radar
The use of radar has spread into many diversified fields since its introduction as an aircraft-tracking instrument at the beginning of World War II. One of the first non-military uses it was put to was tracking weather balloons. Not long after, it was discovered that, given the proper wavelength, radar could detect clouds and the position of rain and hail in storms. Since then its use has extended to tracking satellites, investigating the atmospheres of several planets in the solar system, including our own, determining the trajectory of meteors and predicting their points of impact and studying lightning and violent storms (Battan, 1962).
In general, radar provides information for determining the velocity, range, elevation and azimuth of the reflecting objects in its field of view. Indirectly, it will furnish some data on the state of the matter which is backscattering (reflecting) radio energy; other variables such as temperature and index of refraction can sometimes be inferred.
The resolving power of radar, defined as the minimum distance between two objects (or two parts of one object) necessary to make them appear separate, is poor. Details of the shape of the reflecting object and other features can never be determined except in the most general way and only when the object is very much larger than the radar wavelength. Rayleigh's criterion states, essentially, that in order for two objects to appear separate, the wavelength of the electromagnetic radiation that illuminates them must be of the same order of magnitude as, or smaller than, the distance between them. This principle, applied to the most common types of radars used in weather surveillance, explains their lack of resolving power because their wavelengths are ten centimeters or greater. In addition, the argument that the resolving power of the all-sky camera is poor because the ratio of image size to emulsion silver grain size is small, applies here: if the range of a typical weather radar is 450 km., the ratio of the area of the image of even large solid objects to the area covered by the scope is exceedingly small.
The range resolving power of radar is also dependent upon pulse duration. The limit of resolution in the direction of propagation is half the linear dimension of the pulse because at intervals less than that the echo formed by the leading edge of the pulse reaching the more distant object overlaps the echo formed by the trailing edge of the pulse returning from the nearer object. Thus, if the radar is "looking" at two objects in its "line of sight," and if its pulse duration is 1 µsecond, it will not display as separate from each other, in-line targets whose ranges differ by less than 500 ft.
Radar reports information in three coordinates: range, elevation, and azimuth. The resolving power in the range coordinate is determined by pulse duration. Resolving power in elevation and azimuth depend upon the same conditions that apply to optical resolution. Rayleigh's criterion for the optical resolution of a telescope can be used for this purpose, if the radar antenna is circular and its diameter is regarded as its aperture. Resolving power is proportional to the ratio of the wavelength to aperture (diameter). This is another way of saying that the ratio determines the angular beam width of a radar transmitting-receiving antenna. Resolving power is determined for this case by the equation
r = 70°(Lambda/D)where Lambda is wavelength, D is antenna diameter, and 70°(= 1.22 rad.) is the angular size of the diffraction disc image of a point source for unit Lambda/D ratio as derived by Rayleigh. (For other than antennas with a circular aperture, resolving power must be separately computed for the vertical and horizontal planes). Applying the equation to a radar with a wavelength of 3 cm., and whose parabolic antenna has a diameter of 3 m., the beam width, and therefore the resolving power, is found to be 0.7° of arc in elevation and azimuth.
Radar is frequently able to see targets virtually undetectable by the unaided eye or on photographic film. This greater sensitivity is due to marked differences in the signal-to-noise ratio of wavelengths employed by radar compared to the optical wavelengths upon which the eye and the camera must rely. The atmosphere is almost completely transparent to radar wavelengths between 3 cm. and 10 cm. It scatters such waves hardly at all. At optical wavelengths, it is still relatively transparent, but air scatters energy appreciably, especially at the short (blue) wavelengths (Rayleigh scattering): hence, the blue sky. In addition, unlike the radar case, there is a powerful source of optical noise present in the daytime sky -- the sun. Thus, a pale blue object seen against the sky is nearly invisible to the retina or to photographic film, yet if constructed of metal, the object will reflect radar waves strongly.
Design of a radar to track targets very much smaller than the wavelength takes into account that for a given wavelength, backscattering power varies as the sixth power of the target size (Rayleigh's Law of Scattering) and, conversely, for a given target size the power varies inversely as the fourth power of the wavelength. Furthermore, atmospheric attenuation of the beam increases as frequency increases. The balancing of these factors results in the choice of a 10-20 cm. wavelength for radar which are to survey extensive storms such as hurricanes; 3-10 cm. for tracking metallic objects; and 1-3 cm. for studies of rain and hail distributions (Battan, 1959).
The first exact theory of scattering of electromagnetic waves by a sphere was developed by Gustav Mie in 1908. In this theory, the dielectric constant and therefore the index of refraction of the sphere determines in large part the amount of backscatter at any wavelength (Born, 1964). For example, the backscatter from a hailstone is enormously greater than that from a raindrop of equal size, and, as a result, radar can provide data for estimating the amount of ice or hail in a storm cloud. In effect, therefore, it can give information on the state of matter in the scattering object, for example; it can distinguish between wet and dry hailstones.
| Cible | Longueur d'onde | Mean cross-section cm2 |
|---|---|---|
| Hawkmoth | 10,7 | 1,0 |
| Honeybee | 10,7 | 3,0 x 10⁻³ |
| Sparrow | 10,2 | 15,0 |
| 71,5 | 2,5 x 10² (a) | |
| 3,5 | 1,9 | |
| Pigeon | 10,2 | 80,0 |
| 71,5 (a) | 11,0 | |
| Pigeon | 3,5 | 15,0 |
| 3,5 | 1,1 head | |
| 100,0 | broadside | |
| 1,0 | tail | |
| (a) Transmitted beam vertically polarized; received echo also vertically polarized. | ||
| (Table taken from Glover (1966) and Conrad (1968). | ||
Anomalous reflections called "angels" can sometimes be ascribed to certain atmospheric conditions. Temperature inversions cause rapid changes in the index of atmospheric refraction at the interfaces of the layers and such changes can give rise to radar echoes exactly as similar conditions account for mirages in the case of visible wavelengths. (Voir Section 3, Chapitre 5 et Section 6, Chapitre 5).
As would be expected from Maxwell's equations, radar echoes will be produced by regions of high ionization where there is an appreciable density of free charges. This is the reason why lightning paths are visible to radar. The density of charges in the trail of a meteor is different from that in the immediately surrounding space, and the radar echo arises from this difference in space charge, not by reflection from the nucleus of the meteor itself (Lovell, 1954). Depending upon the magnitude of the radar "cross-section" some "angels" can be ascribed to echoes from birds or even insects. "Cross-section" is better defined as the ratio of the reflected power per unit solid angle to the incident power density; in other words, it is a measure of the effectiveness of the target in reflecting radiation and will have a different value for each wavelength. Inasmuch as birds and insects are usually smaller than radar wavelengths, their actual dimensions cannot be measured, although their radar cross-section can be (Glover, 1966). This quantity, for several species of birds and insects is tabulated below as a function of radar wavelength:
The extreme sensitivity of radar is well illustrated here: The insect targets were at least 10 km. distant and the birds at ranges between 10 and 20 km. when the measurements were made. Because of the poor resolution of the radars, the cross-section is simply a measurement of relative backscattered power and not the actual spatial extent of the object on the radar scope. In other words, the moth can be distinguished from the sparrow only by determinations of the power received rather than by shape and size; the head of a pigeon cannot be differentiated from the tail.
The radar return does, however, contain information which provides a basis for identifying an unknown point target as a bird ...
Thus, the radar return from single birds in flight differs ... from other possible point or dot targets, such as aircraft, swarms of insects, several birds together, or small clouds or other meteorological structures (Conrad, 1968).
Radar météo
Of the 14 types of radars used by the U.S. Weather Bureau, only the WSR-57 which is equipped with a 35 mm. camera appears to be adaptable to UFO searches. The salient features of this instrument are enumerated below:
| Wave Length cm. | Pulse Length & Rep. rate | Peak Power Output K.W. | Beam Width | Sweep Characteristics | Scopes | Range | Altitude |
|---|---|---|---|---|---|---|---|
| 0,5 micro/s at 658 pulses/s ou 4,0 micro/s at 164 pulses/s | 10,3 (5 et 2,5 cm. planed but not yet on order) | 500 | 2° | Automatique, manuel en altitude ou azimut à 0-24°/s | PPI, RHI, R, A | 464 km | -10° à +40° |
These radars are placed around the perimeter of the Weather Network and are interspersed with the eastern stations of the Prairie Network in Minnesota, Iowa, Kansas, Oklahoma, Missouri and Illinois. They are, therefore, well located to furnish corroboration of sightings in any future investigations.
The sky coverage of these radars is obviously less than that of the airglow photometers since they are limited in their choice of elevation and they have only a 2° sweep width.
The photographic program which has been carried over the last few years consists in taking one scope picture of one sweep every 15 min. in times of clear weather and more frequently when storms were developing. These films are available for inspection, but the Colorado project made no attempt to search for confirmatory evidence of reported sightings because each photograph covers only 1.7% of each hour of elapsed time.
Radar de météores
The facilities of the Radar Meteor Project of the Smithsonian Institution are located at Long Branch, some seven miles south of Havana, Ill. They consist of a network of eight receivers and one 4 Mw, 40 MHz transmitter, with antennas bearing 113°T. This direction was chosen as the most favorable one for the detection of faint meteor trails.
The main lobe of the radiation pattern from the two transmitting antennas is inclined upward at 45° and has a half-power horizontal width of ~20° and a half-power vertical width of ~11°.
Pulses of 6 µsec. duration are emitted at the rate of about 1300 per second, so that the echo from an object 200 km. distant will return within one pulse cycle. An object in the beam at 200 km. will be about 140 km. above Decatur, Ill. The Havana radar is thus designed to scan approximately the same volume of sky monitored by an image orthicon located at Sidell, (near Urbana) Ill. (see Section 12).
The radar will detect meteors as faint as mrad = +13 for counting purposes, and mrad = +11 and will acquire echoes from 3,000-4,000 meteors/hr.
The system is capable of receiving echoes from objects at almost any distance from the transmitter. In order to limit the information to "suitable" meteors, meteor-recognition logic has recently been installed which filters out extraneous signals such as those from aircraft. These echoes are, however, visible on the monitoring oscilloscopes and are characterized by a persistence greater than that of meteors. Data pertaining to "suitable" echoes is recorded on magnetic tape. Similar, but unfiltered data is simultaneously recorded on film (Smithsonian, 1966).
During 1967, many non-meteoritic echoes were seen on the oscilloscopes and recorded in the Havana log book. Using the film record, the Colorado project sought to determine how many of the UFOs sighted during 1967 in a radius of ~140 km. from Havana, had resulted in an echo which had been both filmed and logged. Of nine cases (the same used to test the orthicon), seven had occurred when the station was not operating. The eighth case covered a series of sightings over a period of 10 days during which the station was operating. Unfortunately, only very sketchy observing data were available. The object was seen from Kilbourne, about five miles south of the transmitter, "over the west south-west horizon." Station attendants had been alerted that unusual objects had been seen in the area. The absence of entries in the log book implies that nothing unusual appeared on the scopes. This is not surprising because echoes of objects very close to the station are lost in the display formed by the transmitted pulse, particularly at low altitudes. If the objects had been farther away but bearing ~140°T (WSW) they would not have been located within the main lobe of radiation bearing ~113°T. Objects outside this zone of maximum transmitted power would return echoes too faint to be observed against background "noise."
The ninth object is the one that the image orthicon recorded in a test run on November 7th, 1967 at 2330±3 m. It was subsequently identified as a fireball. No simultaneous radar sighting was made because the radar was not in operation.
The Image Orthicon
One of the important problems in meteor physics is the crosscorrelation by simultaneous radar and optical meteor observations of ionization and luminous efficiencies as functions of velocity.
The development of the image orthicon has made such cross-correlation studies feasible. The instrument is a conventional vidicon television camera modified so as to increase its sensitivity. This is achieved by adding an image intensifier ahead of the scanning mechanism in the camera. The result yields a sensitivity equivalent to an ASA rating of 100,000. Such extreme sensitivity permits detection of meteors having a limiting magnitude of about +7. This is well within the equivalent Mrad range detectable by radar, and considerably superior to the capability of any photographic system except the 48 in.
Schmidt telescope at Mt. Palomar. Tests show that the image orthicon will detect 20-30 meteoroids per hour.
The image orthicon site in Sidell, Ill., about 35 mi. SE of Urbana, was chosen by the Smithsonian Institution with two objectives in mind. Using a lens having a 16° field (the optimum lens for meteor surveys), the image orthicon is sited to survey approximately the same area of sky over Decatur as that covered by the 20° beam of the Long Branch radar (see previous section). But whereas the radar is sited so as to track the meteor trails at about right angles, the image orthicon is located so that its optical axis is more nearly parallel to the meteors' paths.
Linked by microwave and radio, the radar and the image orthicon are able to determine times within 10^-2 sec., thereby minimizing ambiguities as to the identity of the objects observed.
As in conventional television, an 875-line scan samples the tube target in two sets of sweeps of alternate lines, each requiring 1/60 sec. When the alternate sweeps are interlaced, flicker and resolution are greatly improved. The electronic image is recorded on magnetic tape and can be immediately played back for viewing on a monitor. Used in this way, the high sensitivity of the image orthicon permits the acquisition of moving aerial objects that would be undetectable photographically because of the effect of trailing. Photographic records of the monitor images can be recorded by a 35 mm. camera operating at any desired frame speed. The sensitivity of some image orthicons can be further increased by operating them in the integrating mode. In this procedure, the electronic image is swept away less frequently, thereby allowing the photoelectron population due to ultrafaint images to build up. The Smithsonian image orthicon has no provision for this technique, nor does its camera permit the making of time-lapse photographs which are preferable when the device is operating in the integrating mode (Williams, 1968).
During 1967 there were nine sightings of UFOs within a distance of ~200 km. from Urbana. (These were the same sightings which were correlated with the radar records.) Eight of the sightings occurred before testing of the image orthicon began in August. The ninth was a sighting on 7 November at 2230±3 min., of a bright object between Urbana, Ill. and Lafayette, Ind. This event was recorded on the image orthicon tape during a test. A film of the tape clearly shows a bright mass moving rapidly across a corner of the field. The object is badly resolved due to its great brightness, but the shape of the image suggests that the meteoroid had already broken into two pieces. Preceding the meteoroid image is a large ghost image which is the result of reflections between the lens elements. Just prior to the appearance of the meteor, a small object can be seen moving at 90° to the fireball trajectory. This object has been identified by Wright-Patterson AFB as a satellite.
Proton Magnetometers
The variation in the magnitude and direction of both the horizontal and vertical components of the earth's magnetic field is of such importance in geophysics that a network of some 240 geomagnetic observatories have been deployed by several countries at stations all over the globe (NAS 1968). Thirteen of these stations exist in the continental United States and of these, three are situated on the western edge of the Prairie and Weather Radar networks.
Most of the instruments at the geomagnetic stations are proton magnetometers. These instruments have a sensitivity of about 1 Gamma (=10-5 gauss) in magnetic field strength. This means that the instrument is capable of detecting at a distance of 185 m. the field strength along the axis of a single-turn circular conductor 20 m. in diameter in which a 100 amp. direct current is flowing. In addition to this extreme sensitivity to field-strength fluctuations, the proton magnetometer is capable of detecting 0.1' of arc in declination, defined as the deviation of the horizontal component of the earth's magnetic field from 0°T. Since the mean strength of the earth's magnetic field at midlatitudes is about 50,000 Gamma, the instruments are sensitive to about one part in 50,000 of the earth's field.
Assuming a model consisting of a line current in the vortex extending from the ground to a height of 10 km. and an image current of equal length in the earth, Brook (1967) calculates that the current in a tornado, which caused a 15 Gamma deflection in a magnetometer 9,6 km. distant, was about 1000 amp. Revising the model to make it more realistic, he assumes that a 20 km. horizontal line current 6 km. above the earth joins a 6 km. vertical line current to the earth together with an equal earth image. The current necessary to produce the observed 15 Gamma field is then only 225 amp.
Consideration of the electromagnetic effects produced by tornadoes suggests that some UFO sightings may have been stimulated by these storms, and that continued photographic, geomagnetic and radar observations would be useful in studying them.
The claim that UFOs produce powerful magnetic fields could also be investigated by proton magnetometer measurements. The problem, however, is a familiar one: thus far it has not been possible to bring instrumentation to the scene of a sighting while UFO phenomena were still observable.
Des articles de Vonnegut et Weyer (1966) et Colgate (1967) contiennent des listes étendues de références sur les phénomènes d'énergie de tornades. La plupart des informations pour cette section a été fournir par le Dr. Joseph H. Rush de l'Observatoire des Hautes Altitudes au Centre National de la Recherche Atmosphérique à Boulder (Colorado).
Lasers
The use of lasers in tracking objects is analogous to the use of radar, the principal difference lying simply in the wavelength of the radiation in the emitted pulse. As in radar tracking, the information obtained is range, azimuth, and altitude, but the accuracy of laser ranging is expected to be better than in 3 cm. radar by a factor of two, because of the smaller effect of atmospheric water vapor on the refractive index at the laser wavelength.
The extremely good collimation of a laser beam, where the angular spread is less than 2 x 10⁻⁵ radians (a few seconds of arc), is a two-edged sword insofar as the development of laser ranging is concerned. The narrow beam increases the accuracy of azimuthal data and diminishes the transmitted power required to yield a detectable return signal; but this very narrowness increases the difficulty of scoring a hit on a rapidly moving object in low orbit.
Laser ranging has been in the developmental stage for only a few years and, at the present state of the art would be of only limited value in UFO investigations. However, laser technology is advancing rapidly and it seems quite probable that future laser ranging devices could be useful in UFO searches.
Observations et commentaires
The description of a phenomenon requires the collection of many of its qualitative and quantitative aspects. If the data relating to these aspects is sufficient to permit the construction of a model then this model can be identified as belonging to one or another known category of phenomena if their mutual similarities are numerous enough. Conversely, if the similarities are not numerous enough, it may be necessary to identify the model as a member of a completely new category.
In the majority of UFO sightings, the amount, type and quality of the data have been insufficient even to describe the event, to say nothing of identifying it with a known classification. Data from many other sightings have been adequate for identification with familiar phenomena. to a reasonable level of confidence, but in no case have the data been either detailed or accurate enough to class the event as a new phenomenon.
The lack of instrumented observations has curtailed investigation of a number of events which sounded fascinating and on the threshold of revealing something novel. No matter how detailed or how intelligent the reports of observers, qualitative statements could not serve to define an unfamiliar phenomenon. To do so requires a quantitative description of a number of basic characteristics, some of which are listed below:
- Dimensions.
- Position, that is, coordinates in some frame of reference, usually with respect to the observer.
- Shape.
- Mass.
- Motion - velocity and accelerations, particularly with reference to the method of propulsion.
- Interactions with other systems - effects of electric and magnetic fields on surrounding objects, emission of energy in the form of exhausts, light and sound, aerodynamic lift, ionization.
- Matter primarily involved - the composition and state of matter and its temperature, rigidity and structure.
- Origin - the genesis of the phenomenon, the conditions which gave rise to it, its presence in and mode of transport to the region in which it was observed.
Instrumentation to acquire knowledge of these characteristics must be designed with appropriate regard for the behavior shown both by UFOs and some other phenomena which can be loosely classed together as objects difficult to identify. Any instrumentation for the detection and identification of these objects must be elastic enough to cover the wide range of expected behavior. A comparison of various salient characteristics of some objects observed in the atmosphere is set out in Table 6.
| Météores | Satellites et ré-entrées de satellites | Appareil | Tornades | OVNIs | |
|---|---|---|---|---|---|
| Source ponctuelle (S. P.) ou objet étendu (O. E.) | S. P. à moins de boule de feu | S. P. à moins de ré-entrée | S. P. de nuit O. E. de jour | O. E. | S. P. de nuit O. E. de jour |
| Luminosité propre | oui | lumière réfléchie oui (ré-entrées) | oui, feux de navigation | oui ? [Vonnegut et Weyer 1966] | oui, de nuit |
| Luminance | élevée | faible | faible | faible | faible à élevée |
| Direction du mouvement - non prévisible, linéraire, ballistique ou orbital | linéraire ou ballistique | linéraire ou orbital | straight or slowly curving | slowly varying | non prévisible |
| Effets électromagnétiques, autres que visuels | some evidence exists [Romig 1963] | aucun | aucun | possible mais non établi [Vonnegut 1968] | parfois |
| Close approach to or contact with ground | infrequently | ré-entrée seulement | oui | oui | so reported |
| Distance à observateur | nombreux miles | nombreux miles | de proche à éloigné | généralement plusieurs miles | de proche à nombreux miles |
| Durée d'apparition | 1-15 s | < 5 mn | < 5 mn | de quelques s à de nombreuses mn | de quelques s à de nombreuses mn |
| Echelle de vitesse | <17 km/sec | < 8 km/s | < 0,6 km/s | < 0,03 km/s | unpredictable |
| Altitude | 10-100 km. | 100-2200 km. | < 26 km. | > 13 km et< 19 km. | zero to very high |
| Direction | isotrope | Constante ; d'Ouest en Est, polaire ou d'Est en Ouest | isotrope | isotrope | isotrope |
| Autre | characteristic illumination | most common in central states | no apparent geographical distribution |
An explanation of some of the statements in the table is of interest:
Duration:
-
The large majority of meteors have been observed to have a duration shorter than 15 sec. Thus if a meteor moving
at 30 km/sec at an altitude of 80 km. is visible over 160° of sky, its path length will be
d = 2 x 80 km.
tan 10°= 900 km. so that it will have a maximum distance from the observer of 450 km. Therefore, it will be visible for not more than
t = 900
30= 30 sec. However, most meteors do not usually have the luminance to be seen at a distance of 450 km.
- In the case of satellites, one which has a 90 min. period at an altitude of 200 km., and can be seen over 160° of sky, will be visible for about 4.5 min.
- Tornadoes occasionally persist for a long time and travel many miles.
Velocity range:
- The lowest meteor velocity (prior to the last few seconds before impact) is 17 km/sec. The greatest velocity imparted artificially to a small object is 14 km/sec by means of a four-stage rocket in a ballistic trajectory and a final boost with a shaped charge. (McCrosky, 1968)
- Satellites with a near-escape velocity of 17,000 mph have a velocity of only 7.6 km/sec.
- For aircraft, 2,000 km/hr or 0.6 km/sec.
- A tornado usually moves at 5-70 mph., (0.002-0.03 km/sec).
Altitude:
- The Prairie Network attempts to get stereo-pairs of meteor photographs for trajectories at 40-80 km. in altitude and downstream single photos at 10-40 km. altitude to predict the point of impact.
- Perigee and apogee of most satellites lie in the range of 100-2,000 km.
- Aircraft: 26 km. = ~16 mi. = ~80,000 ft.
Vonnegut (1968) states that although thunderstorms spawn tornadoes, the higher the storm the greater the probability of formation. "Ordinary" thunderstorms at an altitude of about 8 mi. rarely produce tornadoes while those at 12 mi. often do."
- Meteors appear in a region bounded by a few degrees on each side of the plane of the ecliptic and their trajectories will be oriented isotropically with respect to their points of origin.
- Satellites launched from Cape Kennedy will travel from west to east, with a small southward component; those launched from Vandenberg AFB are most often in a polar orbit, though some are in retrograde orbit.
- Aircraft, of course, will be seen moving in any direction.
- Tornadoes seem to have no observable directional pattern.
- The Prairie Network covers about 80% of the volume of space above each camera station. This is as good a coverage as can be found with any instrument except certain types of radar, all-sky cameras, and airglow photometers.
- The coverage is continuous, during periods of good visibility from dusk to dawn, or, roughly, about 30% out of every day. Radar has the advantage of daytime coverage over optical systems, but resolution and identification is not as good. The presence of "angels" and other anomalies, complicates the interpretations.
- Certain other means of detection, such as photometric scans, have much longer ranges and therefore probe very much larger volumes of sky. But these systems suffer from the same disadvantages as radar.
- No other optical network exists which is as extensive as the Prairie Network, the coverage of which is ~0.13 of the sky over the U.S.
- The network .has been designed to produce data which allows the direct computation of altitude, azimuth, velocity, and brightness from which loss of momentum and impact coordinates can be found. Radar will acquire the same data but will record neither the visual identifying signals emitted by a plane nor the brightness of a meteor.
- Objects recorded by a photographic time exposure show a continuous projection of their position in time. In many radars the object is located only once every sweep and since each sweep may have a period of six to 15 sec., rapid course changes may result in an inability to identify successive images as belonging to the same object.
- Although the network is at present purely pictorial, it may shortly be improved by the addition of a spectrometric camera at each station.
- Devices such as airglow photometers cover the sky well but also have shortcomings similar to radar because each scan at a given zenith angle requires a relatively long time and a complete sky survey requires several scans taking several minutes.
- Most photometric scanners plot intensities as a function of time on paper tape. Reduction of this data to coordinates is not as accurate as interpretation of the network film, although it is good enough for airglow and aurora studies.
- Differentiation between near-orbital or ballistic objects and the star background is much simpler in network photographs than on photometric scan tapes because star trajectories on film are obvious, whereas on tapes a pulse produced by a reflecting or self-luminous object can be distinguished from a pulse produced by a star only by comparing its coordinates with those given for stars.
- Scanning radar sky coverage is very good, but identification of objects photographed on the radar scopes is much more difficult than objects seen photographically, both because of poor resolution and because of the lack of characteristic patterns such as flashing lights on planes, and so forth. Weather radar, however, would be a useful adjunct to a photographic patrol, particularly since a portion of the weather radar system is interlaced with the network. In general, it can be said that the most effective use of radar lies in confirmation of velocity, range and direction.
- Image Orthicons and Vidicons: The use of these photoelectric devices is growing, largely because their sensitivity is greater than film by a factor up to 10^4. Such systems can also store and reproduce the image immediately. These attributes make them valuable instruments in investigations of aerial phenomena of any kind, including UFOs.
- A number of UFO reports have indicated electromagnetic interactions with terrestrial systems: radio and TV interference, stalled internal combustion engines, and the like. It would be desirable to investigate the frequency with which UFOs exhibit such interactions as well as the field strengths and direction. No network of stations making routine recordings of atmospheric electric potential exists at present in the U.S. Electric potential measuring devices might be incorporated into joint geomagnetic weather radar and Prairie Net work system at a later time.
- There have been persistent reports that sometimes sounds accompany the passage of large meteors (fireballs) and the re-entry of satellite debris. There is evidence that these sounds have been heard at great distances, sometimes simultaneously with the time of passage. This suggests that fireballs give rise to electromagnetic fields which either interact with the surroundings of the observer, or directly with the observer himself, to produce audible waves (Romig, 1963, 1964). Stations containing geomagnetic or electric potential measuring devices should also be equipped with tape recorders and appropriate acoustical sensing devices.
- Other instruments such as ultra-violet and infra-red sensors, and radiation-counters would also be desirable.
- The Super-Schmidt cameras developed for meteor studies are sensitive and have a 55° field but they are few in number and individually cover only a hundredth of the area of sky covered by one Prairie Network station. The Baker-Nunn cameras which were designed for satellite tracking have a much smaller field and although there are perhaps 16 of them in all, they are scattered all over the world.
- Sky surveys made through large astronomical telescopes cover too little sky at each exposure. Because of their slow photographic speed, only very bright objects moving with respect to the star background will be recorded.
- The Tombaugh Survey for small natural earth satellites was an extremely systematic search (Tombaugh, 1959). This technique would hardly be suitable for photographing UFOs.
The capabilities of existing instrumental systems to record the characteristics necessary for quantitative descriptions of UFOs vary widely. The Prairie Network can supply data on position and motion at all times; under ideal conditions it might be capable of determining dimensions and shape but it cannot directly describe mass, interactions, the matter associated with the event, its origin or manner of locomotion.
Radar is more limited in its information return. It can report position and motion, even when the phenomenon is invisible to the network, but it cannot furnish information on any other characteristic, with the possible exception of the state of matter. Photometric scanners are even more limited.
Determining mass and kind of matter, and extensive analysis of the structure and organization of an UFO require that such an object, if one exists, be made continuously available for instrumented study.
If all the eight characteristics listed at the beginning of this section describe adequately an UFO, then no network, simple or complex as presently constituted, can help us far along the road toward the identification of that type of event which today defies explanation.
What is required is a modified and extended network, so designed that its component systems complement each other, and so integrated that it can provide storable data in a form suitable for interdisciplinary study.
More specifically, the network should be organized along the following lines:
- In the interests of economy and speed, arrangements should be made to have access to the output of the Prairie Network, and the cooperation of its investigators.
- Similar arrangements should be made with the Weather Radar Network and a program of photography developed along lines suitable for the acquisition of data on tornadoes and other transient phenomena not detectable by time-exposure photographs.
- Simultaneous observations with the several geomagnetic observatories which lie in or near the combined Prairie Network-Weather Radar nets should be provided for.
- Link these three networks, and other devices, such as tape recorders and radiation monitors, together to a single time base. This step is important, for example, in testing reports that fireballs have been heard at the same time as their appearance, although their distance from the observer would normally require a many-second interval between sight and sound.
- The tedium of a patrol can be relieved by the installation of various automatic sensors, but the degree of discrimination offered by these devices is often not as great as that of the human eye. It is true that the eye is, in general, incapable of making quantitative and reliable observations suitable for network studies, but it is a very sensitive detector with a wide angle of view and search, and these qualities should be used. It will be recalled that Tombaugh supplemented instrumental with visual search for small natural satellites. Visual search could probably benefit from a tie to an "early warning" communications network of amateur radio operators.
- Photoelectric and electromagnetic sensors cannot only give early warning of the approach of an event of interest, but also are capable of actuating detecting and recording instruments much more rapidly than the human on patrol.
- The operation of the network can be made flexible. Costs can be reduced by maintaining a minimum staff in maximum collaboration with other search organizations.
- Combined network operations should start as soon as the photographic, radar and geomagnetic nets are linked in time. Installation of additional instrumentation should be deferred until a backlog of observations has been studied.
| Running and maintenance, Lincoln, Neb. | 25000 $ |
| Supplies: film, chemicals for 64 cameras ($500/camera/year) | 32000 |
| Scanning of film | 10000 |
| Data reduction, all projects | 65000 |
| Astronomers' salaries etc. | 28000 |
| 160000 $ |
The cost of a program organized in this way should be two to three orders of magnitude less than most current proposals. The capital and operating expenses of the Smithsonian Meteorite Recovery Project can be taken as a measure of these costs. It is estimated that to duplicate the Prairie Network would cost about 150000 $, not including the cost of the cameras and lenses which were lent by the U.S. Air Force. It is difficult to arrive at that part of the total operating expense for meteorite research applicable to an UFO network because the cost figures include operation and data reduction of Super-Schmidt cameras at Wallops Island, and the new image orthicon installation at Urbana in conjunction with the radar at Havana, Ill. The total annual expense, however, can serve as a guide for the proposed combined network:
Assuming that the combined network will not have to bear any of these costs, it would seem that, initially, at least, its expenses could be limited to the salaries of a principal investigator, a junior investigator and one technician, the cost of film exposed by the Weather Radar scope cameras, travelling expenses and miscellaneous items. It would be surprising if expenses would exceed 50000 $ annually. Because of the rarity of the UFO phenomena, the investigation should continue for a minimum of five years. It is anticipated that the total cost would exceed $250,000, however, because preliminary results would suggest equipment modifications and additions.
Recommandations
The problems involved in sightings of UFOs warrant the mounting of an instrumented effort to arrive at reasonable identifications of the several phenomena involved, and to add to the limited knowledge which exists about those phenomena. Present knowledge amounts to little more than suppositions.
Popular preoccupation with the notion that UFOs may be intelligently guided extraterrestrial space ships has had one undesirable effect: it has embedded in the term "UFO" the unfortunate connotation that if a phenomenon is unidentified it must somehow be extra-terrestrial.
It has become apparent that the clarification of the "unidentifiable 1%" referred to by Hynek (1966) may more likely result from investigating several rare phenomena, rather than one. If evidence of extraterrestrial intelligence is uncovered by the study, then the goal of the research can be changed and a full-scale investigation launched.
Until that time comes - if it does - the pursuit of knowledge about the less dramatic phenomena can go on in a modest way, using already established facilities, extended when, as and if the need arises, with additional equipment.
With the de-emphasizing of the ETI hypothesis must also come a complete elimination of the term "UFO." Its connection with an otherwise soundly-based research program can serve only to impair that program's effectiveness. After all, it is beginning to look like a misnomer in certain cases: the sighting may not involve an "object," meaning a solid mass; it may not "fly" in the sense of having aerodynamic lift, and often it remains "unidentified" only briefly.
Plusieurs suggestions ont été faire pour enquêter sur ce que l'on appelle maintenant des phénomènes étranges
.
Le Dr. James E. McDonald, de l'Université de l'Arizona a
recommandé un programme en plusieurs étapes, dont le coût irait de quelques dizaines de millions of dollars
à des dépenses globales au niveau de milliards de dollars US par année
(McDonald, 1967, 1968).
W. T. Powers de l'Observatoire Dearborn a discuté de la conception d'un nouveau réseau photographique couvrant 1 % de la zone des Etats-Unis ; le coût de cette couverture totaliserait près de 2x10⁶ $ et 2x10⁷ $ pour une couverture de 10 % des U. S. (Powers, 1968). Le Dr. G. H. Rothberg dans son rapport pour ce projet d'une tentative at first-hand observations and UFO photography recommande une nouvelle conception d'appareils photos et un "petit" effort coûtant peut-être 1x10⁷ $ (voir cas 27). Larry W. Bryant, après avoir suggéré un satellite de surveillance de la Terre spécialement conçu dans le but de la surveillance des activités ovnis, trouve qu'il coûterait 5x10⁷ $ et nécessiterait 5 années d'effort du financement et de la conception jusqu'au lancement (Bryant, 1967).
The UFO phenomenon is extremely rare. Whereas some 500 meteors per year have trajectories which can be reconstructed from photographs, and none has been recovered in the three or four years of the Prairie Network's existence, Hynek states that only 600 UFO sightings since 1947 have remained unidentified by the Air Force (Hynek, 1966). If this number is adopted as the equivalent of the "1% unidentifiable" events, sightings due to strange phenomena occur at the rate of only 30 per year. Other arguments further lower this figure to 18 or less per year (Page, 1968).
The number of sightings of rare phenomena is so low that it is impossible to make a meaningful geographical distribution. Whether the site of the Prairie - Weather Radar - Geomagnetic Network will eventually turn out to be the best location cannot now be predicted; its present advantage lies in the fact that the three detecting systems are interlaced over a small area, thus facilitating an investigation involving several disciplines.
It is because these sightings are so infrequent that the recommendation is made to use existing facilities, wherever they happen to be, and to proceed with such studies in a measured and thoughtful manner.