We considered that the haze layer between 1500-2000ft, possibly marking the top of the weaker local inversion, could have played a part by scattering reflected light. The light intensity scattered by aerosol particles is sensitive to the angle of incidence and the droplet size. We had ignored scattering by the haze layer when considering sun rays reflected from the sea or lakes, since in these cases most of the rays would be incident on the layer at a large fraction of the ~45° elevation of the sun (relatively few specular glint points from capillaries would be directed at a shallow angle near 0°, we found), and in these circumstances the forward scattered intensity near 0° would be very weak, regardless of the droplet size. But reflected sunrays from a glasshouse roof with a shallow 23° pitch would be incident on the underside of the layer at a grazing angle, and the forward-scattered intensity could then be relatively strong. Possible effects could be to soften and enlarge the light source (Capt Bowyer did report that the UAPs, although brilliant, were neither "dazzling" nor "tiring to the eye"), and/or to produce a diffraction corona.
One immediate difficulty is that under binocular observation the UAPs appeared "very sharply defined" at the edges. Diffusion by a scattering layer ought to spread and soften the specular reflection, not sharpen it. Perhaps a sufficiently bright area of light might appear sharply defined by overloading the retina, thus making a flat field that has a sharp cut-off. But that effect would define a "dazzling" or "tiring" image, contrary to what was reported. Capt Bowyer noted that the UAPs were not intense enough to cause noticeable afterimages, even when using binoculars.
We then have to deal with the fact that two UAPs were observed, identical in every respect except angular size and angular position/motion. One possibility is two distinct haze levels, illuminated by light rays scattered almost in the direction of the observer from a single terrestrial source. A narrow pencil of specular light rays behaving like an inverted "god ray" could intercept the lower layer first, with some light being scattered out of the beam to cause the smaller and more distant bright patch. Enough light might still be transmitted to the higher layer to create a nearer and larger patch slightly to one side as viewed from the Trislander. The relative lateral motion could then be explained in a very natural way in terms of parallax: Over time the separation reduces. When the plane's course intercepts the angle of reflection the two spots coincide and finally cross one another.
A simpler variant on this scenario would explain the small UAP#2 as the source itself, source of a beam of specularly reflected light visible directly by off-axis rays falling a degree or two outside the narrow cone of brightest reflection, whilst the cone of brightest reflection intercepts a fairly thin haze layer below the aircraft at 2000ft causing a larger offset patch of scattered light visible in the position of UAP#1. UAP#2 appeared initially a degree or two to the W of UAP#1, nearer to the sun azimuth, suggesting a pencil of sunrays reflected forward at a few degrees elevation from a Venlo roof ridge oriented approximately E-W and intercepting a haze layer a degree or two to the E (left) of the source as viewed initially from the Trislander.
One merit of the theory is that it offers a possible explanation of Capt Patterson's sighting from the Jetstream. A pencil of strong sunrays intercepting the haze layer would scatter to some extent in all directions. It might well be the case that whilst the most efficient scatter occurs near the forward direction, sufficient photons are backscattered (even a few percent of a bright light source might be sufficient n1100 Thayer, G. D., "Light Scattering by Aerosol Particles", Gilmor (ed), Scientific Study of Unidentified Flying Objects (Condon Report), Vision Press, 1970, pp.646-650) to be visible from the south as a patch of light in the triangulated position of UAP#1.
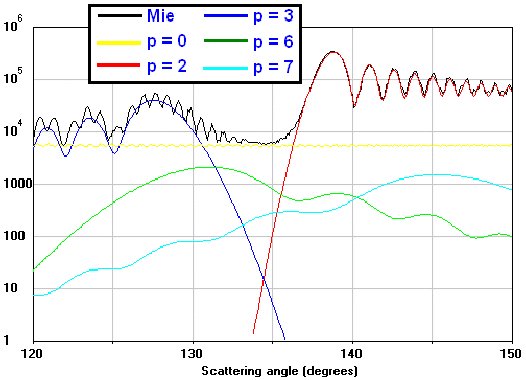
The exact result is very sensitive to the size and nature of the particles, but the components of the overall Mie scattering solution typically sum to a secondary scattering maximum at 180°, composed of different back-scattering peaks at smaller angles due to different scattering processes. For example the graph in Fig.30 (produced by the Mieplot programme written by Philip Laven) shows the phase dependence of scattering from 100micron droplets, where it is noticeable that the first and major backscattering mode, p=2 (red curve, one internal reflection, which is the same path responsible for primary rainbows), becomes significant at angles greater than about 140° with order-of-magnitude fluctuations damping towards 180° (100micron is probably large, but indicative).
This type of effect could fit our triangulated position of UAP#1 (Fig 7). Initially at ~1413 Capt Patterson is unable to see anything in the indicated area. He is at this time around 160° of bearing from the hypothetical incidence angle, and also only about 12.5nmi from the hypothetical location at ~6500ft, therefore ~4500ft above the haze, viewing the scattering volume at a depression angle of ~3.5°. By 1414:43 when he reports visual contact he is 17.5nmi away and down to ~4000ft, nearer the haze and now viewing the scattering volume from ~140° at a depression angle of only ~1.1° and reducing. It seems possible that the complicated changing relationship between the Jetstream's course and the peaks and nulls in the phase diagram, which would occur as family of cones centred on the axis of specular reflection, could cause a patch of light to appear only intermittently. But when we calculate visual elevation angles from the Trislander n2 Using a flat-earth approximation here as the largest distances are only about 60% of the earth horizon distance and it is the relative elevations that interest us. this model does not work so well.
We find that from the position of the first sighting at 1406Z a source on Guernsey and a UAP#1 haze patch at 2000ft would both be at a depression angle of ~1.0°. Conceivably azimuth angle might also coincide, in which case the source (UAP#2) could be located directly in line of sight behind UAP#1. This common LOS would by definition lie along the peak intensity of the reflection. Changing parallax during approach could cause the source to emerge into direct view, its secondary image becoming intrinsically dimmer (as the viewing LOS leaves the angle of most intense reflection), but at the same time growing larger, as the flux per unit angular area increases like the inverse square of reducing distance to the scattering volume. We can perhaps thus explain why UAP#2 is not seen until later and why UAP#1 remains bright when viewed off-axis.
But we cannot explain why UAP#2 then appeared above UAP#1 (see Fig.4 & Appendix B). It would appear at all times below it, and by the time of the last sighting at 1418Z we find that whilst the nearer, projected, image (ex hypothesi, UAP#1) would appear at a depression angle of about -0.2°, the source on Guernsey (the smaller UAP#2) would be at about -0.7°, or 0.5° below UAP#1. This is the opposite of the behaviour observed n3103 Might an additional mirage have inverted and transposed (inferior inversion) the images of source and haze projection? This implies ray-crossing (due to the gradient of refractive index being much greater in the lower part of a mirage layer) in the ~12-21nmi between the location of the UAP#1 haze patch and the Trislander. But for this raycrossing to invert the two images we need a differential refraction equal to (~0.5° + the observed vertical separation of ~0.3°) = 0.8°. This difference in refractivities over the two paths is obviously the minimum true abnormal refractivity produced: Unless the abnormal refractivity on one of the two adjacent paths is zero (which is not physically realistic), the true maximum refractivity of the required layer must be significantly greater than this, i.e.,>>1.0° at the observer. In 12nmi (22km) with a trapping gradient of 33"/km we can get a total refraction of 12arcmin. So we certainly need >5 times the refraction produced by a strong (trapping) optical duct of 33"/km between Guernsey and the Trislander. There is no meteorological case whatever for such an extraordinary atmosphere. .
By reducing the altitude of the haze layer to about 1200ft we can reduce the expected visual elevation of UAP#1 towards coincidence with UAP#2; but we find that it remains impossible to get UAP#1 to appear below UAP#2 as reported without dropping the haze scattering volume to as little as ~600ft. This is probably not consistent either with observations or with meteorology. And we have introduced the further problem of explaining the visual identity under binocular inspection (in terms of detailed form, sharpness and brilliance) of a direct specular reflection and of its secondary reflection in a far-off patch of haze. This seems unrealistic.
So we adopt the more complicated hypothesis of two separate co-altitudinal haze images caused by an unseen source or sources of reflection. In this case we can get the more distant and angularly smaller UAP#2 to stay above UAP#1 as observed (without unphysical refractive index gradients), and we can still possibly account for the early lack of detection of UAP#2 because although the difference in elevation angle is not zero, it is small, in the order of 0.1°. Conceivably the brightness of the larger and brighter UAP#1 swamped the adjacent UAP#2, and magnetised attention, until the vertical separation angle grew during approach by a factor 4 to ~0.4° at ~1413.
But this raises other questions: What is the chance that two different sources (themselves unseen even though ex hypothesi close to the line of sight n4 We previously considered a single pencil of sun rays reflected from a single source and intercepting two stacked haze layers in succession - one absent source would certainly be easier to explain than two. But then it is not possible for the two UAPs to be co-altitudinal. They are aligned on the same optical axis originating on Guernsey, with the same problem of relative elevation that we sought to avoid by making them co-altitudinal in the first place: UAP#2 can once again not appear consistently above UAP#2 as observed unless the two physically separate haze layers are so close together, and/or at such low altitude, as to conflict both with observation and with meteorological reasonableness.) simultaneously satisfy, for the same observer, and persistently, the conditions of what must be a rare (never-before seen) reflection geometry? What is the likelihood that these sources would both produce scattered light patches of identical narrow "cigar" shape? Conceivably the two pencils of near-collimated specular rays strike a scattering layer that is physically very thin, so that any arbitrary area of illumination viewed at a shallow angle will tend to look long and narrow. But even so, how could we explain that both images display an identical "graphite grey" vertical band in the corresponding position?
One other factor we considered in the haze-scattering scenario was coronal diffraction. Sunrays specularly reflected at a low angle into haze will be diffracted through a small scattering angle depending on the droplet size. This angle needs to be large enough to explain the persistence of the "brilliant" UAPs through rotation of the observers' LOS. The rotation due solely to the radarplotted motion of the Trislander is as much as 10° in relation to the forward-scattering haze location of UAP#1 n5 5° in relation to an unseen source (ex hypothesi) on Guernsey.. Could a corona remain "brilliant" through such a large scattering angle?
This is by no means certain. Typical ratios of intensity between the peak forward scattering lobe at 0° and the first null in the diffraction pattern can be two, three or even four orders of magnitude, and the first sidelobe can be about an order of magnitude below the peak. The angle to the first sidelobe will be inversely proportional to the droplet/particle size, so we can choose a small droplet to widen the angle of the peak lobe n6Scattering profiles can be modelled using MiePlot v3501.exe (https://www.philiplaven.com/mieplot.htm), IRIS (https://www.atoptics.com) or similar applications of Guernsey) one is bound to wonder if this mechanism is capable of delivering the near-specular brilliance of the images observed.. Diameters in the order 100micron produce a bright, narrow peak lobe near 0°, but they are likely too large to remain in a suspended haze of this type. A 10 micron droplet produces a peak lobe of about 1° radius, a first null at about 2° and a coronal lobe at about 3°, which is heading in the right direction. A 5micron droplet increases the radius of the first null to beyond about 4°, and can begin to accommodate the necessary LOS rotation. But at the same time the scattered intensity is inversely proportional to the scattering angle, and at 5micron is now relatively very weak. Given the inherent inefficiency of the off-axis viewing conditions required and the thin haze (having insufficient opacity to obscure the island of Guernsey) one is bound to wonder if this mechanism is capable of delivering the near-specular brilliance of the images observed.
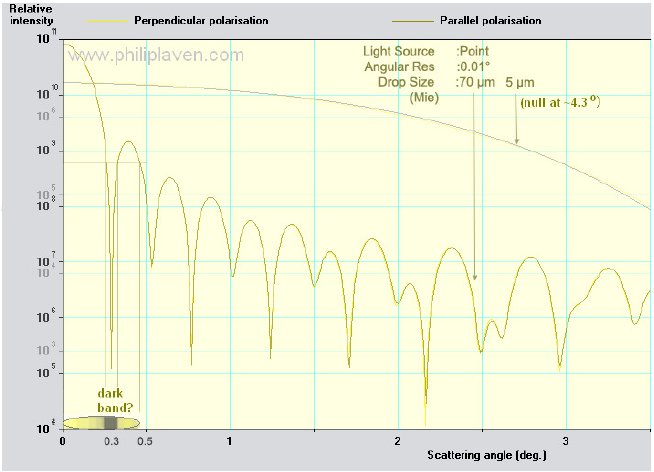
But if coronal diffraction does play a part it is natural to wonder if the "dark bands" could be explained by nulls in a diffraction annulus around a brilliant source. In this case we are making different demands of the droplet size. The 5micron aerosol with its first coronal null at ~4° is of no use for this purpose since the angular width of the UAP images was generally smaller than about 1° with the dark bands in the order 0.1°, so with a 5micron haze the null itself would be a soft gradation comparable in width to the entire image. With a larger droplet we can produce a sharper and thinner null. Fig.31 below illustrates the position of the first null in a 70 micron corona.
But this theory implies some very fortuitous selection. The reflected rays would just happen to be intercepted by an isolated patch of haze slightly offset from the optical axis in such a way as to select one thin segment from the right hand side the first annular null, so that it appears 2/3 of the way along the sliver of corona. What is the probability that this happenstance occurs twice with two quite separate coronae produced by two separate patches of haze? If it is reasonable for a haze of this kind to contain droplets sufficiently large to produce a sufficiently sharp corona pattern n7 Dry haze nuclei (salts, dust, pollen etc.) are typically much smaller particles, <1.0micron. In conditions of high relative humidity they expand by deliquescence and the optical thickness rises appreciably. The resulting droplets can be of arbitrary size, becoming mist, fog, cloud or precipitation. The reports in this case indicate "not a salt haze". Capt Bowyer described it as caused by "bad air from the continent", indicating perhaps a mix of petrochemical (ozone, nitrous oxides and hydrocarbon) smog, dusts and pollens, which swell less than salt nuclei. The air at the haze level appears very dry (Section 5 & Appendix D). A small droplet size is suggested, which could fit a scattering theory by removing the blue wavelengths and yellowing transmitted sunlight to the "yellow" and even "orange" hues reported. However a fine droplet size would produce far too large a corona for our purposes., this large-droplet requirement is in any case again in tension with the requirement for a broad scattering angle. Note also that the ratio of lobe brightnesses approaches 100:1, and it is not clear that a small, relatively very dim lobe to the right of the null would answer the witness description. A related point to bear in mind is that Capt Bowyer insists, several times, on the "very sharply defined" binocular outlines of both UAPs.
It has been suggested to us that the "dark bands" resemble spectral Fraunhoffer lines. But the only reason spectral lines are called "lines" is because spectra are made to appear in this shape by the way prism spectrographs are made, i.e. the light enters through a narrow slit. In other words the regularity of separated "lines in a spectrum" is an artefact of the instrument and could not occur in this case n8 In nature the equivalent instrument is usually an individual droplet and if you examined its spectrum closely enough you could see Fraunhoffer absorption bands - though they wouldn't look like "lines" across a linear spectrum. In the case of our UAPs the "instrument" would have to produce a symmetry whose axis is linear horizontal in order to separate spectral wavelengths laterally and display a vertical "absorption line". Diffraction is a similar case. If you have a diffraction grating you can get regular lines from a line-shaped light source by orienting the regular grating correctly, but generally because there is no slit it only works with point-like sources and then you get diffraction spectra with 90° rotational symmetry. But diffraction by a random ensemble of cloud particles or the like could not produce any ordered linear symmetry, instead you would get the superimposed chaotic diffraction products of a billion different particles. Small randomly oriented variations in RI cause continual wander of raypaths in turbulent air and this causes scintillation, but again the distribution of RI is randomly chaotic about the line of sight. Also, the colouration in this case is described as a flat field, much like the mixed solar spectrum. No evidence of separated wavelengths. Absorption bands are very narrow in relation even to the separated colour bands within which they lie..
In summary, certain features of the haze-scattering theory are attractive. Given narrow sunbeams from sources of specular reflection on Guernsey we can locate two separate luminous phenomena (two scattering regions of the haze layer) at altitude over the sea in approximately the areas apparently triangulated by observation. And unlike mirage refraction theories this can possibly explain the relative horizontal angular motions of the UAPs in terms of parallax. It is also possible in principle that some backscattered light from the same scattering volume could explain the fainter patch of colour sighted in the triangulated location of UAP#1 by the Jetstream pilot from the south (UAP#2 being of course some miles further SW and out of his field of view).
But other features - the brilliance/persistence; the edge sharpness; the duplicated identical shape, including detail of "graphite grey" bands, occurring (ex hypothesi) in two locations miles apart - these are not easily explainable by scattering of glasshouse reflections from a haze layer. We also take note of the fact that no phenomenon even similar to this has been seen before by Capt Bowyer in 8½ years and hundreds of flights on this same airway in all conditions .
Plausibility (0-5): 3