As mentioned, surface winds across the Channel Islands zone were light and generally southerly, in the direction of the pressure gradient between the falling high pressure over the Mediterranean and the cyclonic low pressure centre to the NW of the UK. These winds are bringing warm air off shore from Brittany where noon surface temperatures (Appendix C, Fig. 2) rose into the low twenties. Warm air advected over the cooler sea in this way might well establish a temperature inversion in the marine boundary layer. Clearly we are interested in the atmosphere all along the line of sight from the area north of Alderney to Brittany (and beyond), and in conditions of offshore advection the profile over the Channel Islands area might be rather different from that over the coastal area.
First, the UK Met Office Form 214 upper air forecast (six levels between 1000 and 24,000 ft) for position Lat 50°N Long 02°30'W, valid 0900-1500UTC, 23 April 2007, was obtained (Appendix C, Table 2). This is an ocean location some 20nmi NW of Alderney and is merely representative of a large sea area containing the sighting location. The Form 214, though only a forecast, was the most local upper air weather product available.
Interpolating these upper air forecast temperatures with the FL40 temperature recorded by Capt Bowyer (~10°C) and surface temperatures recorded at Alderney or at Guernsey suggested the possibility of a nonstandard temperature lapse rate in the lowest couple of thousand feet (Table 2)
| Alt | 292 | 335 | 1000 | 2000 | 4200 n1Approximate true altitude AMSL of FL40 based on Alderney QNH pressure setting. | 5000 | 10000 | 18000 | 24000 |
|---|---|---|---|---|---|---|---|---|---|
| a) T°C |
+14 | +14 | +14 | +10 | +09 | +00 | -13 | -26 | |
| b) T°C | +16.5 | +14 | +14 | +10 | +09 | +00 | -13 | -26 |
These profiles suggest temperatures generally warmer than average through the first few thousand feet and an isothermal gradient (no lapse) either from ~300 to 2000 ft or through the 1-2000 ft layer.
However an inquiry to Anthony Pallot (Principal Met Officer, Jersey Meteorological Dept) elicited the opinion that neither of these land surface temperatures can be extrapolated to conditions over the sea, and moreover that the true upper air temperatures probably differed somewhat from the Form 214 forecast.
The sea surface temperatures recorded at Jersey and St. Peter Port, Guernsey on 23 April were 12.2°C and 11.8°C respectively n2 The average of 12° C is corroborated by the Jersey Met Office shipping forecast figure issued at noon, 23 April, and also by Jersey Planning & Environment Dept, Fisheries & Marine Resources, who reported (email 23.07.07) temperatures "of the order of 12 degrees Celsius". The Channel Light Vessel SST measurements give a mean of 11.8° C and max of 12.2° C. The CLV is far to the N in deeper water that one might expect to be if anything cooler, suggesting that SST in shallow coastal water after a recent warm spell might be significantly above the 12° C Channel islands mean. However NOAA-18 satellite IR measurements indicate SST in the range 9.5 - 11.5° C, although the map shows very few reliable pixels in the area due to cloud and haze. On the other hand the Meteo-France ALADIN numerical simulation utilises 12.4° C for coastal water near Lannion.. This suggests a possible temperature inversion in the first 1000 ft over the sea. Based on knowledge of the actual conditions in the area on the date Tony Pallot's best estimate of the temperature profile over the sea between Guernsey and Alderney is shown in Table 3. This profile adheres quite closely to the local area 1300-1800Z aviation forecast for that day.
| Alt (ft) | surface | 1000 | 2000 | 5000 | 10000 | 18000 | 24000 |
|---|---|---|---|---|---|---|---|
| T°C |
12 | 15 | 14 | 10 | 0 | -15 | -25 |
Here a surface inversion gradient of 2°C/kft suggested by the Form 214 upper air forecast is modified to a 3°C/kft gradient over sea n3The revised estimates for the elevated levels in Table 2 would suggest a ~3° C/kft inversion over land at Alderney, and a slightly superadiabatic lapse rate (-3.75° C/kft) above Guernsey, but these are probably not very meaningful. . This would be "reasonably typical of a profile in a warm sector". This conclusion was independently confirmed to us by Jersey meteorologist Frank LeBlancq: "(T)here was an inversion on the day but it looks like only 2 or 3C, whereas a good inversion would be (say) 6C or so" n4 Email from Tony Pallot to Martin Shough, 25.07.07; email from Frank LeBlancq 27.07.07..
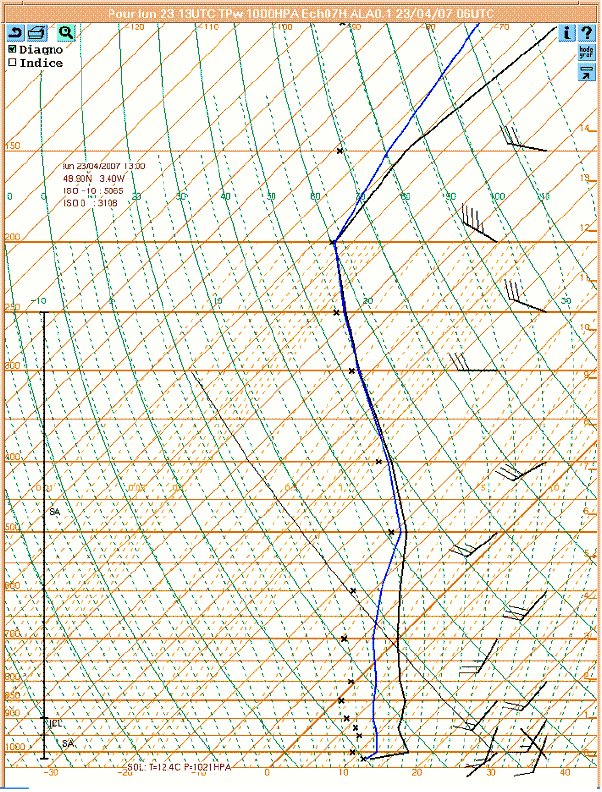
Conditions south of the Channel Islands area were further investigated for us by the French government agency Meteo-France who kindly performed a computer numerical simulation at our request based on all data available to them. The representative location for the profile was coastal water at 48.9N 3.4W, off shore from Lannion, Brittany, (which lies close to the line of sight to the UAPs from the Trislander). The simulation was run for 4 hours between 0900Z and 1300Z with a geographical resolution of 0.1° lat/long and for height levels between 0 and 1500m. The result is shown in the skew-T diagram in Fig.20, which represents the vertical profile predicted for 1300Z, a little over one hour before the sighting time, and it is easy to verify the feature described by Thierry Jimonet of Meteo-France, Toulouse, as follows:
. . . near the Breton North coast, we find a rather clear inversion in the very low layers between 0 and approximately 200m above the sea. The pressure at sea level is 1021hPa and the temperature 12.4° whereas the model indicates a maximum temperature of 18.1° for 1014 hPa. That is to say a vertical gradient of approximately 5° for 50m. . . . In this particular case, the model seems to indicate a rather local phenomenon (near to the coast because of a difference in sea/ground temperature) . . . reaching a maximum towards 13-14h UTC n5 Email from Thierry Jimonet to Jean-francois Baure, 03.09.07.
Jimonet points out that Spring is a favourable season for the development of such advection inversions. It was not possible to say how far from the coast the local inversion gradient might extend, but near to the coast, at just under 10°/100m (33°/1000ft), it is on the verge of a trapping gradient, where light rays would be refracted with the same radius of curvature as the earth (33 arcsec/km). This surface layer of ~200m (660ft) depth might therefore act as an optical duct.
We were also interested in a possible elevated inversion which might cause sharp changes in refractive index at around the altitude of the haze layer (since the optical lines of sight to the UAPs from the Trislander were at times reported as tangential to this layer). Although the Meteo-France numerical model n6 Note northwesterly on-shore surface breeze developing by 1300Z (UTC). See Section 6.d.ii. produces no sign of an elevated inversion we sought to check this against direct and indirect evidence in surface met observations and balloon ascents.