These observations are consistent with the fact that Q1 was taken from the surface, which is likely to include vegetal and insect material, while Q2 was taken below the surface in unexposed soil.
Random pinch size aliquots were taken of both samples for scanning electron microscopy (SEM); a second aliquot from Q1, designated below as Q1b, was taken concentrating on black particles for SEM/X-ray analysis.
Aliquots of Q1 and Q2 were glued on aluminum specimen stubs with a layer of conductive colloidal graphite. The mounted specimens were then coated with a thin layer of carbon film in a high vacuum evaporator. They were scanned under the SEM at an energy level of 20 keV.
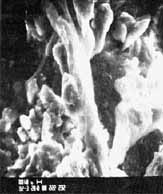
Sample Q1a consists of homogenous aggregates of particles that vary in size. In addition there are tube-like structures intertwined in the clusters. These tubes appear to be hollow and differ greatly in size and length. There are some larger particles over 10 micrometers in size in the aggregate.
Sample Q1b comes from the area concentrating on the black particles viewed in optical microscopy. It appears to contain mostly aggregates of the same particles seen in Q1a, but without the tube-like structures.
Sample Q2 consists of homogenous aggregates with particles of assorted