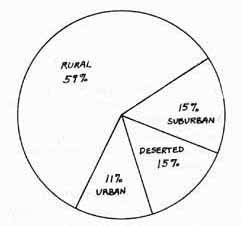
The location of the witnesses was divided into the three categories of "Urban," "Suburban," and "Rural" according to definitions of Standard Metropolitan Statistical Areas used by the government. A fourth category labeled "Deserted" was added to include those localities with no nearby human habitation. The decision of where to place each event was made by referring to the best available maps, on-site investigation, or derived from the original report. The location of the witness was used when it did not coincide with that of the UFO. Figure 1 presents the results.
Fully 74% of the events occurred in rural or deserted areas. This result coincides with that reported by other investigators, such as Vallee (2), that high strangeness events occur predominantly in areas of low population density. There is no absolute data available concerning comparative traffic volume in these different localities; however, it is common sense that, despite the greater distances to be traveled in rural areas, the proportion of miles driven to that in suburban and urban areas must be quite low. This high rate of reports from sparsely populated areas would thus seem to be determined by the nature of the UFO phenomenon itself, rather than just an artifact of the reporting process.
Météo
| Temps | # Cas | % |
|---|---|---|
| Clair | 60 | 55 % |
| Partiellement nuageux | 16 | 15 % |
| Nuageux | 22 | 20 % |
| Brumeux | 4 | 4 % |
| Pluie | 5 | 5 % |
| Neige | 2 | 2 % |
Table 3 presents a summary of the weather conditions that prevailed during the UFO sighting. The categories are discrete, so that if rain was falling in cloudy skies, only the rain was recorded, being the more noteworthy condition.
It is impossible to make any estimates regarding the expected frequency of different weather conditions. One can observe that the high proportion of clear and partly cloudy weather should have afforded the witnesses good visibility when viewing the phenomenon.
Distance to UFO
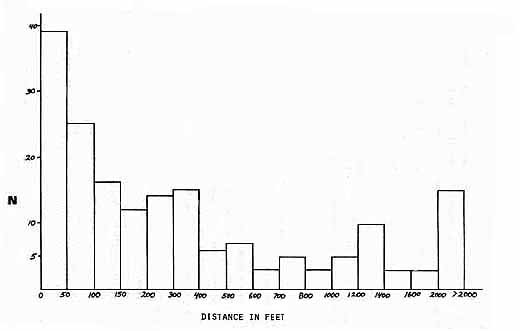
Figure 2 presents the reported distance to the UFO as either estimated by the witness, measured by an investigator after the fact, or calculated through angular estimates or comparisons with known objects. Note that the variation of the number of reports versus distance follows a roughly exponential curve. The median distance to the UFO was about 200 feet, but fully 35% of all reports where data was available placed the UFO within 100 feet of the witness. This is an important fact, for it allows us to place more confidence in the witness' report of UFO characteristics. The phenomenon was near enough to offer the chance for careful observation, depending upon the duration of the event.
Durée de l'événement
| Durée | # Cas | % |
|---|---|---|
| 0-1 mn | 38 | 25 % |
| 1-4 mn | 32 | 21 % |
| 4-10 mn | 37 | 24 % |
| 10-20 mn | 16 | 10 % |
| 20-40 mn | 15 | 10 % |
| 40-60 mn | 6 | 4 % |
| > 60 mn | 9 | 6 % |
The reported durations of the sightings are recorded in Table 4, but not the duration of the phenomenon. No attempt was made to record the duration of the period of interference with the vehicle itself; this duration was rarely available.
This data indicates that an EM event is likely to last for a brief period of time, anywhere from a few seconds to about ten minutes. This result does not compare exactly with that reported from other sources, such as UFOCAT high-strangeness cases, which show a peak duration around five minutes (3). It is not characteristic of reported durations of ball lightning ? one explanation proferred for EM events, which peak at three to five seconds, but in rare cases may persist for several minutes (4).
Since over half of the events recorded lasted for over four minutes, we can conclude that the witnesses often had sufficient time to determine whether the phenomenon in view was ordinary and mundane or extraordinary. They also had time to note carefully the phenomenon's characteristics.
Geographical Location of Event
Roughly one-half of the events occurred in the United States, or 217 cases (49.2%). This figure can be compared to the percentage of all primary entries in UFOCAT from the U.S., which is slightly over 40%. Other countries with several reports are listed below:
| Angleterre | 36 |
|---|---|
| France | 28 |
| Argentine | 26 |
| Espagne | 25 |
| Brésil | 23 |
| Australie | 22 |
While the phenomenon is global in extent, only 29 countries are represented in the catalogue. As one might expect, most reports are from highly-industrialized Western countries where large numbers of vehicles are on the roads and the communication system is well-developed.
Effets psychologiques
| Effet | # Evénements |
|---|---|
| Ressenti chaleur accrue | 29 |
| Remarqué staticité dans l'air | 15 |
| Senti une odeur | 14 |
| Devenu paralysé(e) | 14 |
| A eu contact avec des entités | 9 |
| Ressenti raffraichissement dans l'air | 7 |
| Senti assomé | 6 |
| Entendu des voix | 4 |
| A eu un sentiment d'apaisement | 3 |
| S'est senti sous observation | 3 |
| Effets divers | 24 |
As with all other subclasses of UFO events, some witnesses to EM events have reported an effect on their bodies or immediate surroundings during or after the event. In Table 5, a listing of these effects is presented. While 128 total effects are listed, only 98 events involved a physiological effect. Several witnesses reported more than one effect. The various categories arose during my initial inspection of the reports, but obviously some individual judgment was necessary in categorizing effects. Instances of making apparent contact with entities are listed separately because of their unusual nature. "Stunned" refers to witnesses who felt as if they were in shock, more intense than the fear which most people reported. That is also why there is a separate category for "Feelings of peace" because of the contrast with the normal reaction.
No one effect occurs so often that it could be labeled a typical EM event characteristic. Heating of the air or vehicle occurred in only 7% of the cases; no other effect more often than in 4% of the cases. One possible inference is that each witness reacts in a unique manner to the energy released by the phenomenon. Another is that the phenomenon is not monolithic, but is actually caused by several different mechanisms, each with its particular energy distribution and consequent effect on the atmosphere and witness. Still, 22.4% of the EM events included a physiological effect, a higher frequency than that derived from other studies of high-strangeness UFO events (5).
Type d'ovni
| Forme | # Cas | % |
|---|---|---|
| Disque | 63 | 18 % |
| Disque avec dôme | 51 | 15 % |
| "Lumière" | 81 | 23 % |
| Ovale | 59 | 17 % |
| Cône | 16 | 5 % |
| Cigare | 16 | 5 % |
| Oeuf | 11 | 3 % |
| Irrégulière | 49 | 14 % |
Table 6 displays the results of a classification of the UFO by shape. One category is listed as "Light" to include those UFOs which appeared as a bright light of no discernible structure. Various subdivisions could have been made, but it was decided instead to keep the number of categories small . Under "Irregular" are placed UFOs that were, for example, rectangular, cubic, jellyfish-shaped, or other very odd shapes.
The percentages recorded for each shape are in rough agreement with previous results on UFO type. The largest category is most always the classic disc-shaped UFO, which in this study comprises over one-third of all reports where information was available.
Taille d'ovni
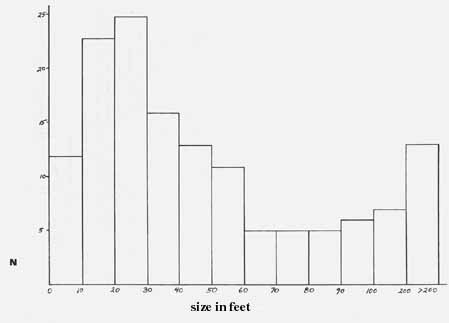
Figure 3 displays the reported largest dimension of the UFO. These estimates by the witnesses are obviously of a lower quality than actual measurement of the phenomenon would provide, but may still be useful in assessing the nature of the phenomenon. Size was recorded in feet rather than meters because it was reported in that system by most witnesses.
There is a decided peak of reports in the ten to thirty-foot range, but a wide variation is evident. Over 9% of the available estimates place the UFO size at over 200 feet.
Présence d'entités
| # entités | # événements | % |
|---|---|---|
| 0 | 384 | 88 % |
| 1 | 16 | 4 % |
| 2 | 12 | 3 % |
| 3 | 7 | 2 % |
| 4 | 5 | 1 % |
| > 4 | 13 | 3 % |
About 12% of the EM events included the sighting of one or more entities, either humanoid or not, which were on or near the UFO. Table 7 lists the frequency of entity reports.
Approximately 16% of the reports from Phillips' catalogue of physical traces involved an entity, a figure that compares closely to this result (6). While not frequent, the observation of an entity during an EM event is not rare.
Much of the data presented in the text has compared closely to previous studies of high-strangeness events. This study has supported or confirmed previous results, extending them to the domain of EM events.
UFO Actions
While the UFO may remain stationary for several minutes during an event, the phenomenon usually displays some type of motion or activity. Table 8 lists the various categories under which these activities have been classified. To "Disappear" means that the UFO simply vanished from sight, without any apparent movement (see case from Risdon Vale, Tasmania on November 9, 1978). "Left Instantly" means that the witness could observe the UFO leave the vicinity, but that this motion occurred in under five seconds, implying a terminal velocity well in excess of 1,000 mph (see the August 1, 1979 case from Lewisboro, New York). "Chased Vehicle" is the author's subjective judgment, or that of the witness when mentioned, that the UFO purposefully followed or chased the vehicle. "Light Beam" refers to the presence of one or more well-delineated beams of light, as from a spotlight or laser. "Rotation" refers to actual rotation of one or more portions of the UFO (rotational periods were rarely specified). The results:
| Action | # Evénements |
|---|---|
| Atterri (contact avec le sol) | 104 |
| Chassé ou suivi véhicule | 73 |
| Déplacé en trajectoire droite | 39 |
| Emis un rayon de lumière | 31 |
| En rotation | 26 |
| Parti instantanément | 25 |
| Disparu | 19 |
| Brume autour de l'ovni | 19 |
| Emis une traînée | 13 |
As BalIester-Olmos has noted in his book, UFOs, A Landing Phenomenon (7), one of the most widely-reported characteristics of all high strangeness UFO events is the frequency of landings by the UFO. About 24% of the EM events involved actual contact with the ground by the phenomenon. This is an interesting result, which may be a clue as to the nature of the phenomenon. At least one researcher, Persinger, has proposed a mechanism to generate EM events which requires such proximity to the ground (8).
No other reported UFO activity occurs frequently, except for chasing of the vehicle, which, given the nature of the EM event, might be expected. Cases involving the actual disappearance of the phenomenon are non-negligible, though, and will be discussed later.
Son d'ovni
| Son | # événements | % |
|---|---|---|
| Hum | 34 | 38 % |
| Whine | 15 | 17 % |
| Sifflement | 6 | 7 % |
| Whoosh | 5 | 6 % |
| Buzz | 5 | 6 % |
| Sizzling | 4 | 4 % |
| Rugissement | 3 | 3 % |
| Explosif | 3 | 3 % |
| Mal défini | 15 | 17 % |
UFOs at close range are rather noisy, as is evident from the data reported in Table 9. Over 20% of the events included some type of sound attributable to the UFO. In most cases, it could be located as emanating from the UFO itself, though in a few instances it pervaded the witness' area so completely that point of origin was hard to pinpoint.
These sounds were categorized using the witnesses' own words whenever possible. Sorting of events was found to be not too difficult or imprecise, as only 17% of the events were either one-of-a-kind or too vaguely described to be of use.
A humming sound, like generators in a power plant, was most often reported, though it occurred in only 8% of all EM events. Therefore, no one sound can be described as a typical characteristic of an event.
Couleur de l'ovni
Without the use of a standard color chart in investigations, and when using secondhand reports, one must be quite careful when analyzing color data. Whenever possible, sorting was accomplished by using the witnesses' own words. If two or more colors were reported on one UFO, both were recorded separately. No distinction was made between large, bright color sources and small, dim sources. Only the primary colors were utilized in coding. The category "Metallic" refers to the colors silver or dark gray, but in particular to those instances when the colored surface appeared metallic to the witness.
| Chronologie de certains événements EM < Home > Rapport d'ovnis impliquants des interférences avec des véhicules |
|---|